Did police staffing losses cause the 2020–2022 homicide wave?
The question
After homicides surged in 2020–2021, a common explanation pointed at police staffing: departments lost officers — through budget cuts, attrition, or both — and the thinner ranks explain the wave. This note tests the staffing version of that story two ways: a panel regression of homicides on staffing, and the timing of the two series.
Data
The sample is a stratified random draw of 25 US cities over 100,000 population (ten each from the 1M+, 300k–1M, and 100k–300k bands of a 357-city frame). Staffing is yearly sworn-officer headcount from the FBI's police-employment data; homicides are yearly city totals from the FBI Crime Data Explorer, 2019–2025 (171 observations).
Specification
We estimate, with standard errors clustered by city:
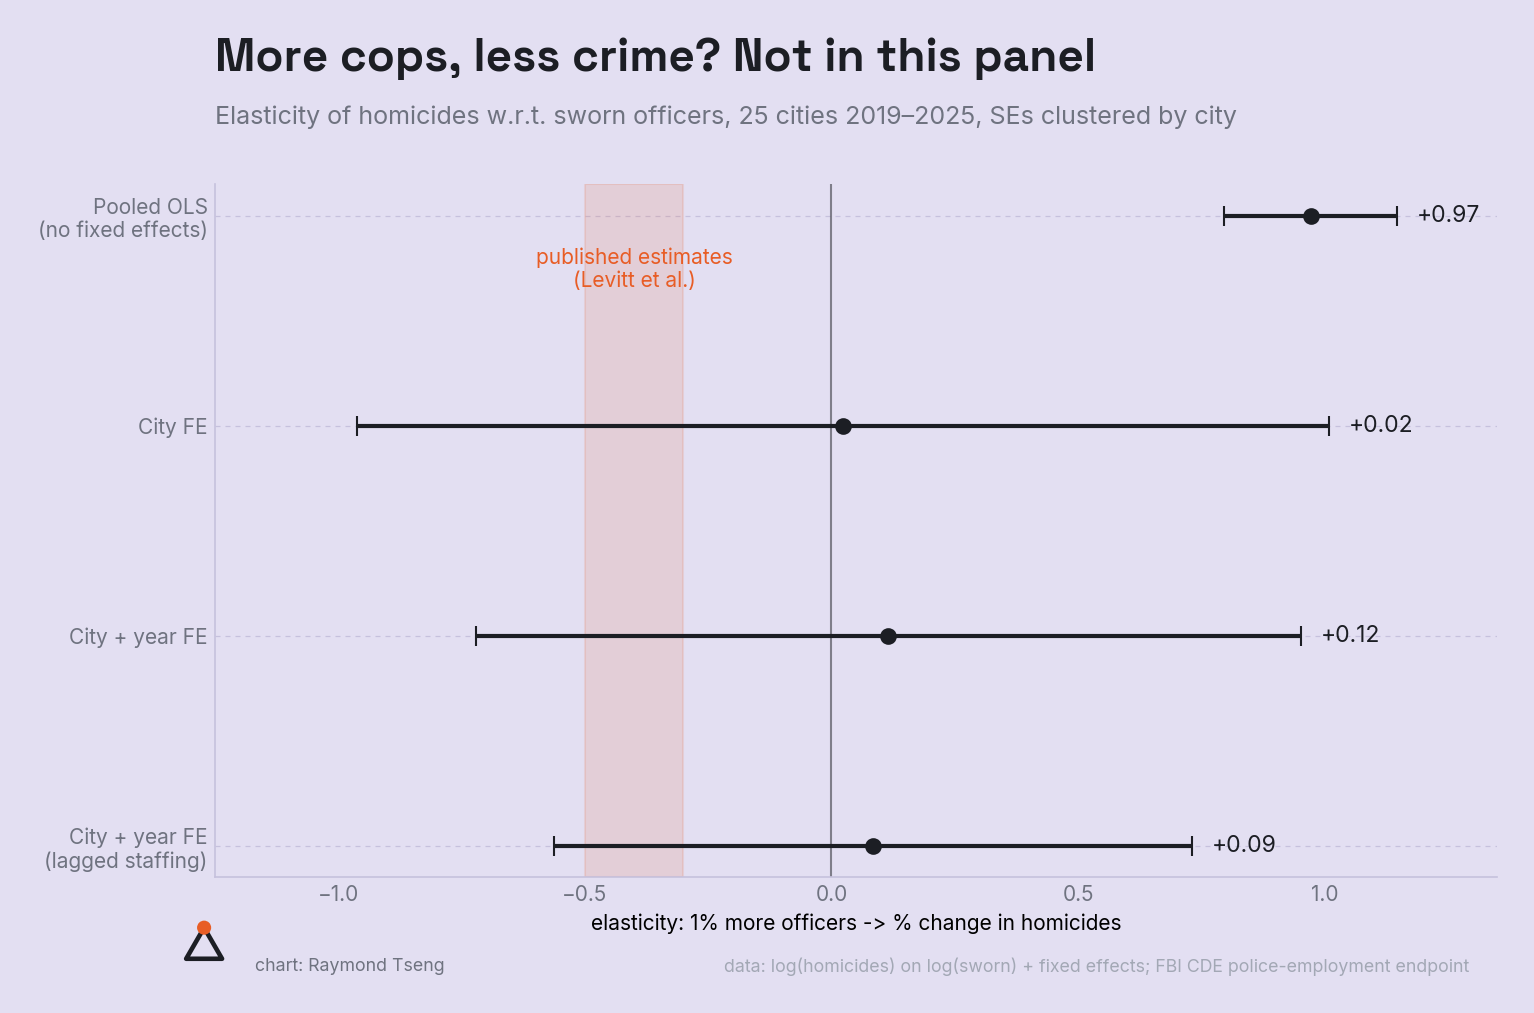
where β is the elasticity of homicides with respect to sworn officers. The published literature on police manpower (Levitt et al.) typically finds elasticities around −0.3 to −0.5: more officers, less crime.
Results
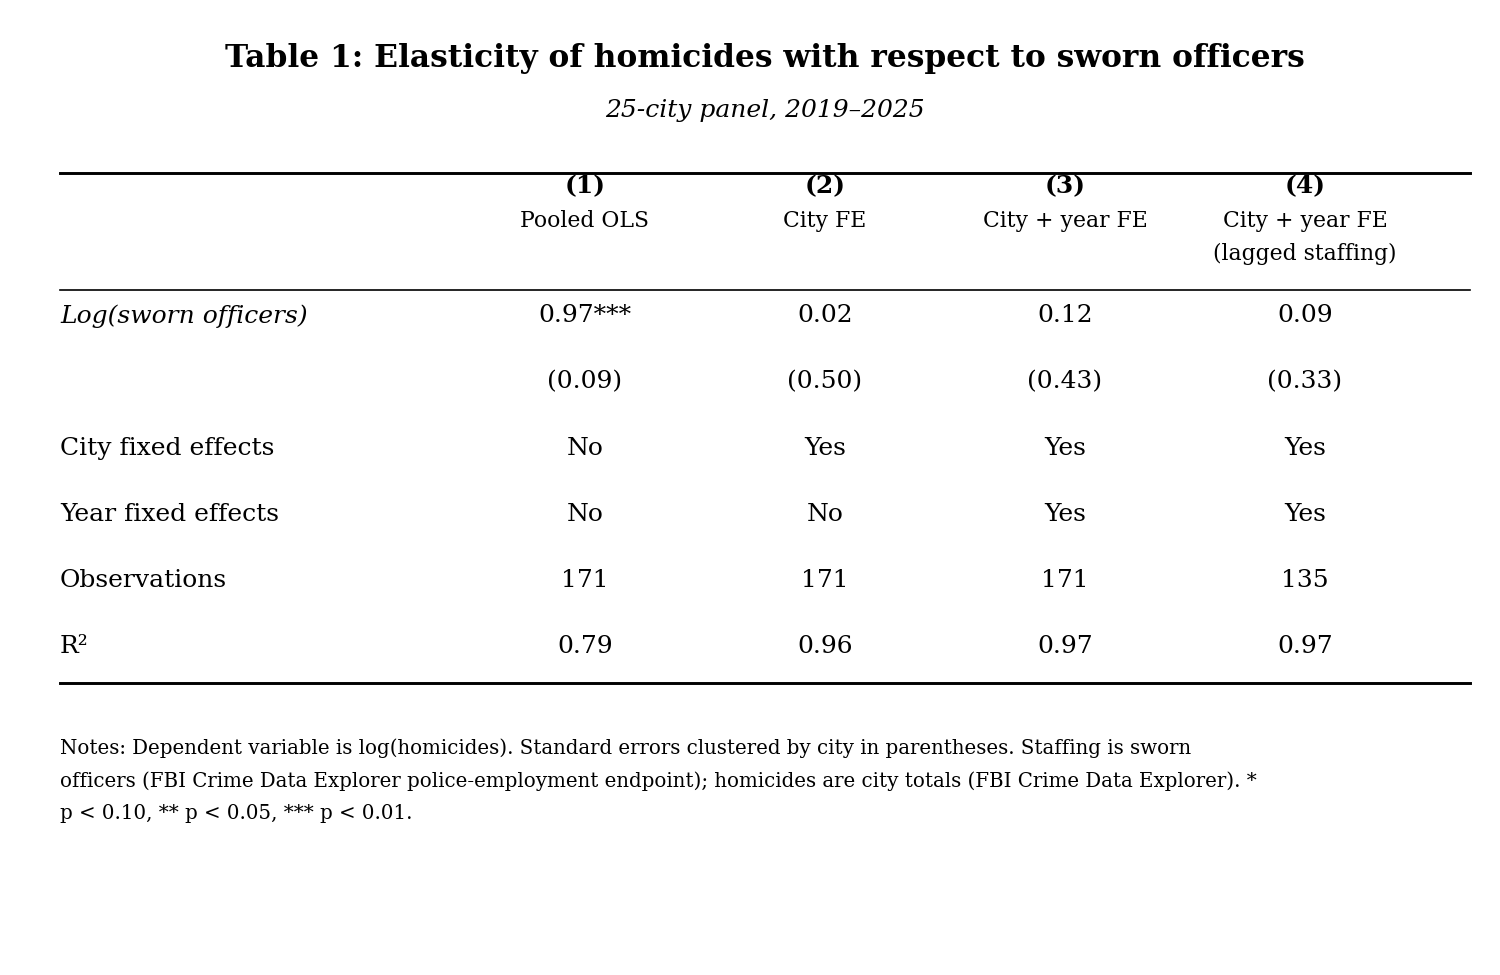
Pooled OLS returns an elasticity of +0.97 — but this is pure cross-sectional confounding: larger cities employ more officers and suffer more homicides. Adding city fixed effects, which restrict the comparison to within-city variation over time, collapses the estimate to +0.02. Adding year fixed effects, which absorb the national crime wave itself, gives +0.12 (SE 0.43); lagging staffing one year gives +0.09 (SE 0.33). In no specification is the estimate distinguishable from zero, and in every fixed-effects specification it carries the wrong sign for the staffing-loss story.
Timing
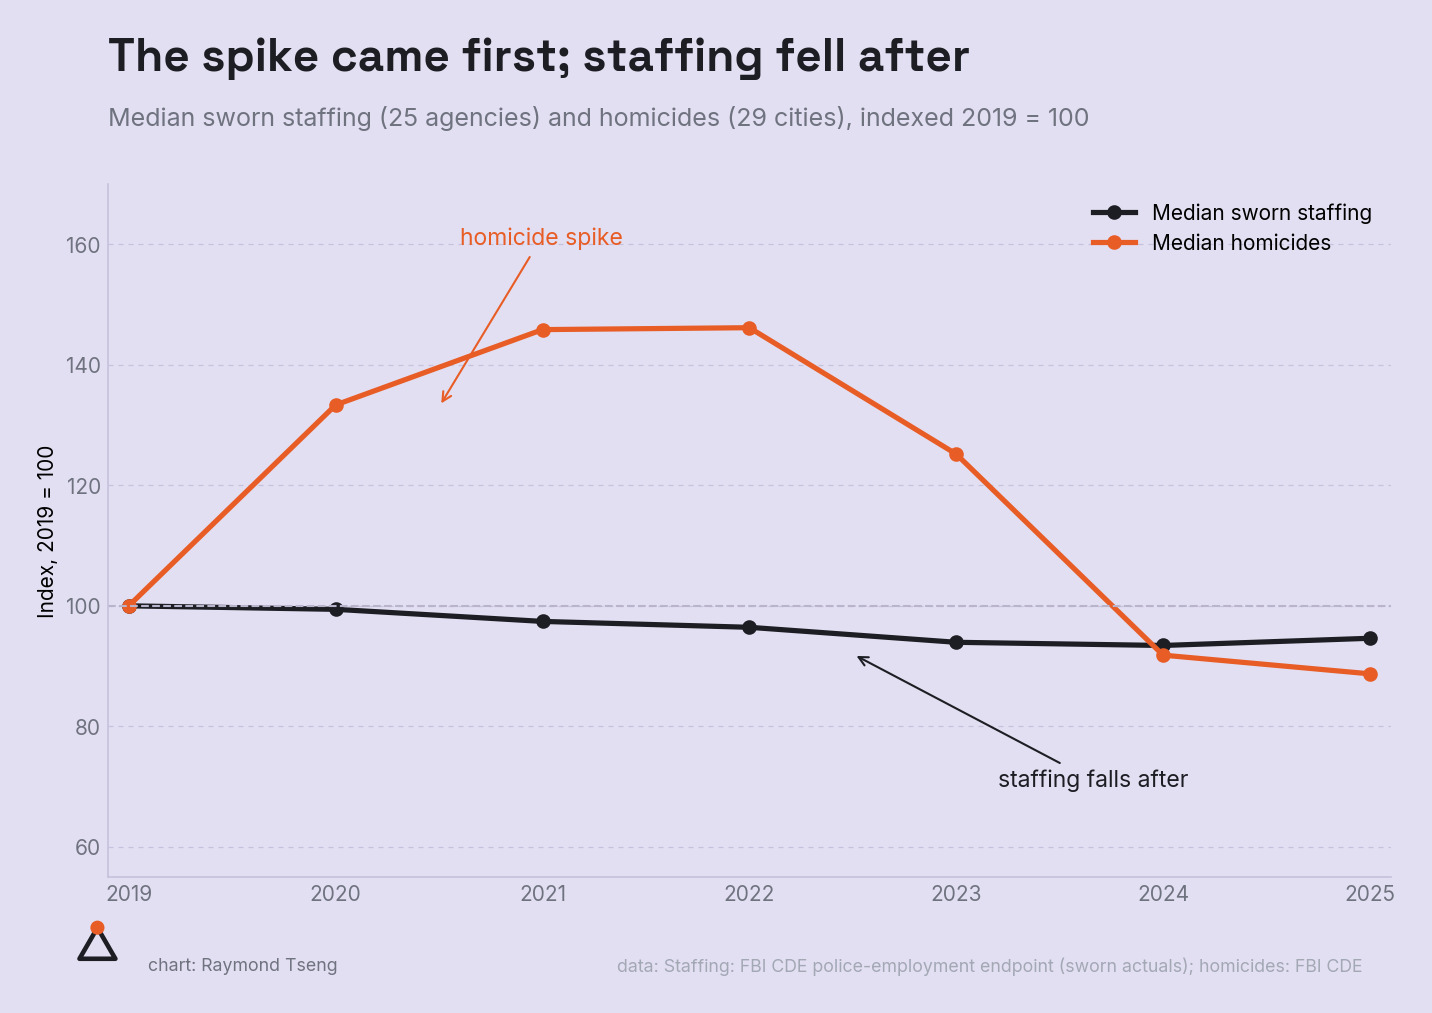
The timing evidence points the same way: median homicides rose 33% in 2020 while median staffing was essentially flat (−0.6%), and the staffing decline of 2021–24 arrived after the spike, while homicides were already falling. A cause has to precede its effect; here the order runs the wrong way.
Caveats
Two, stated plainly. First, with 25 clusters the confidence intervals are wide — this panel cannot reject an elasticity of −0.4. It is absence of evidence more than evidence of absence. Second, staffing is plausibly endogenous: cities hire in response to crime, which biases β upward, so +0.12 should be read as an upper bound on the causal effect. Headcount is also not activity — a de-policing story operating through officer behavior rather than attrition would not appear here.
Bottom line
What the data do rule out is the simple version: the cross-city pattern shows no trace of staffing losses driving the homicide spike, in either magnitude or timing.