About
Offbeat Data is charts by Raymond Tseng — one weird thing at a time.
About text goes here (placeholder).
Music
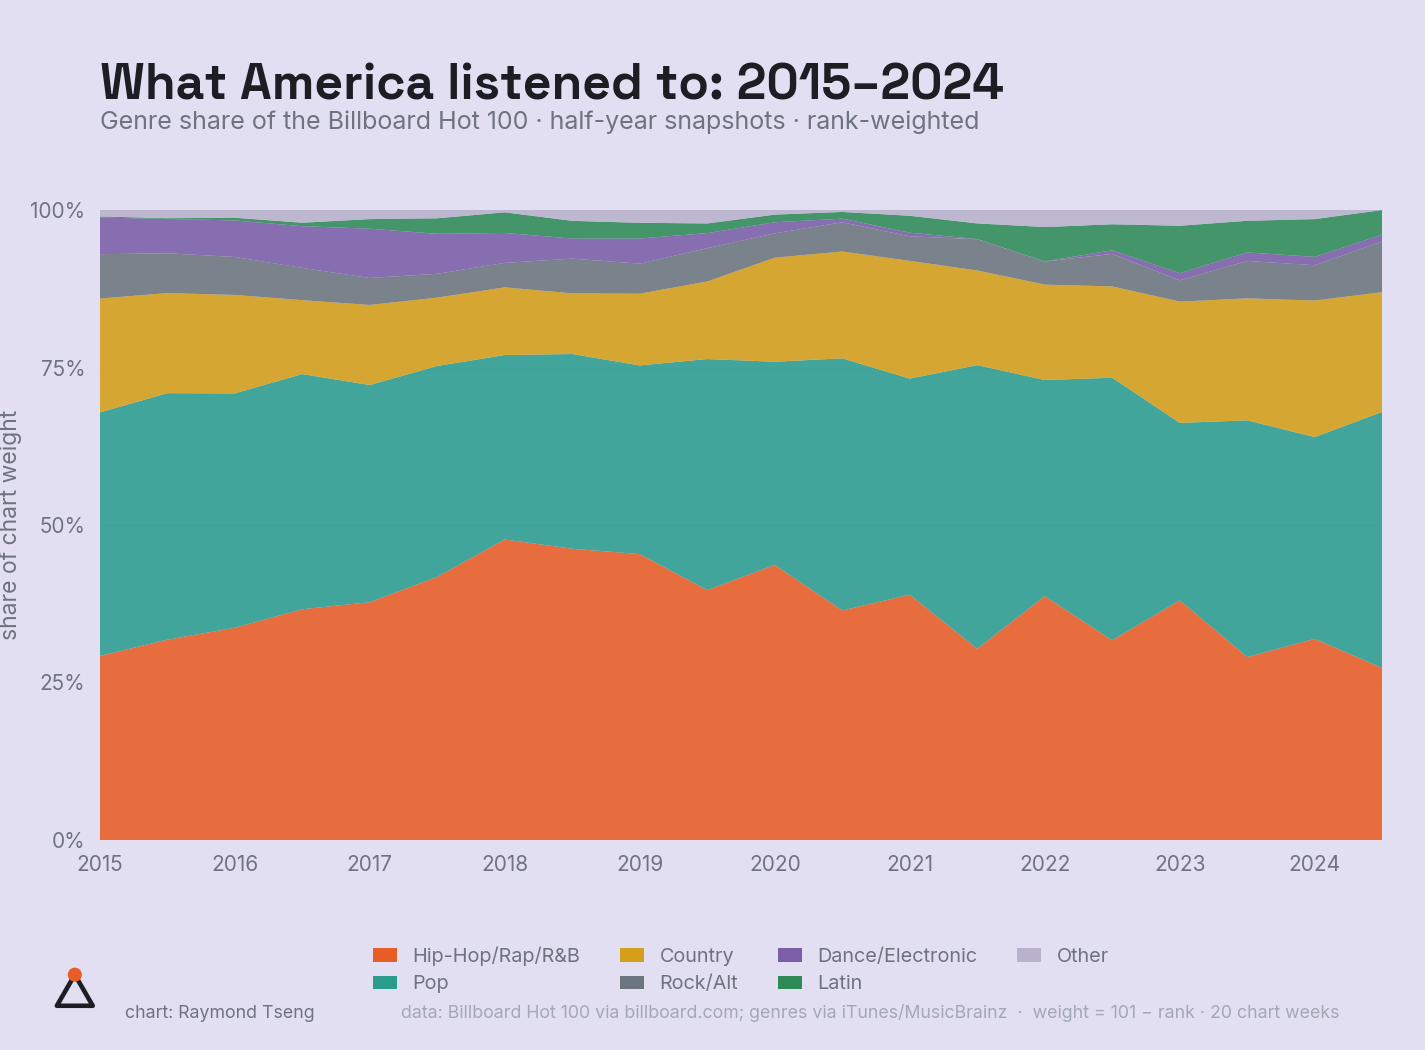
What America listened to: 2015–2024
Hip-hop's Hot 100 share peaked in 2018, then faded — the full chart tells the breadth story.
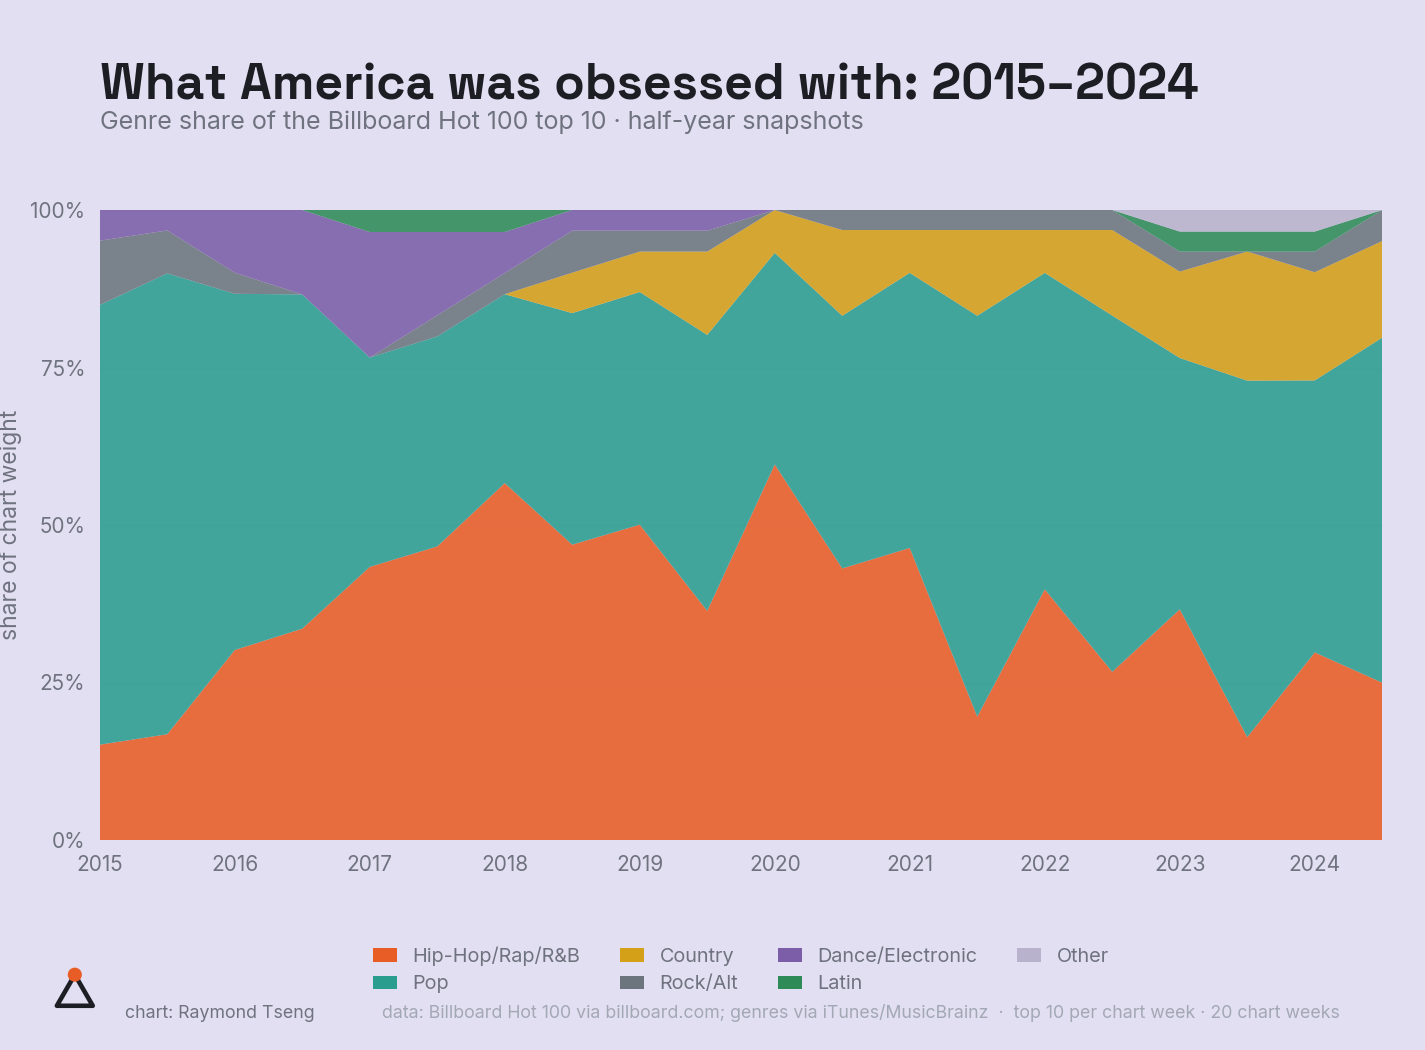
What America was obsessed with: 2015–2024
Same decade, top 10 only: the fade hits harder at the top, where pop refilled the space.
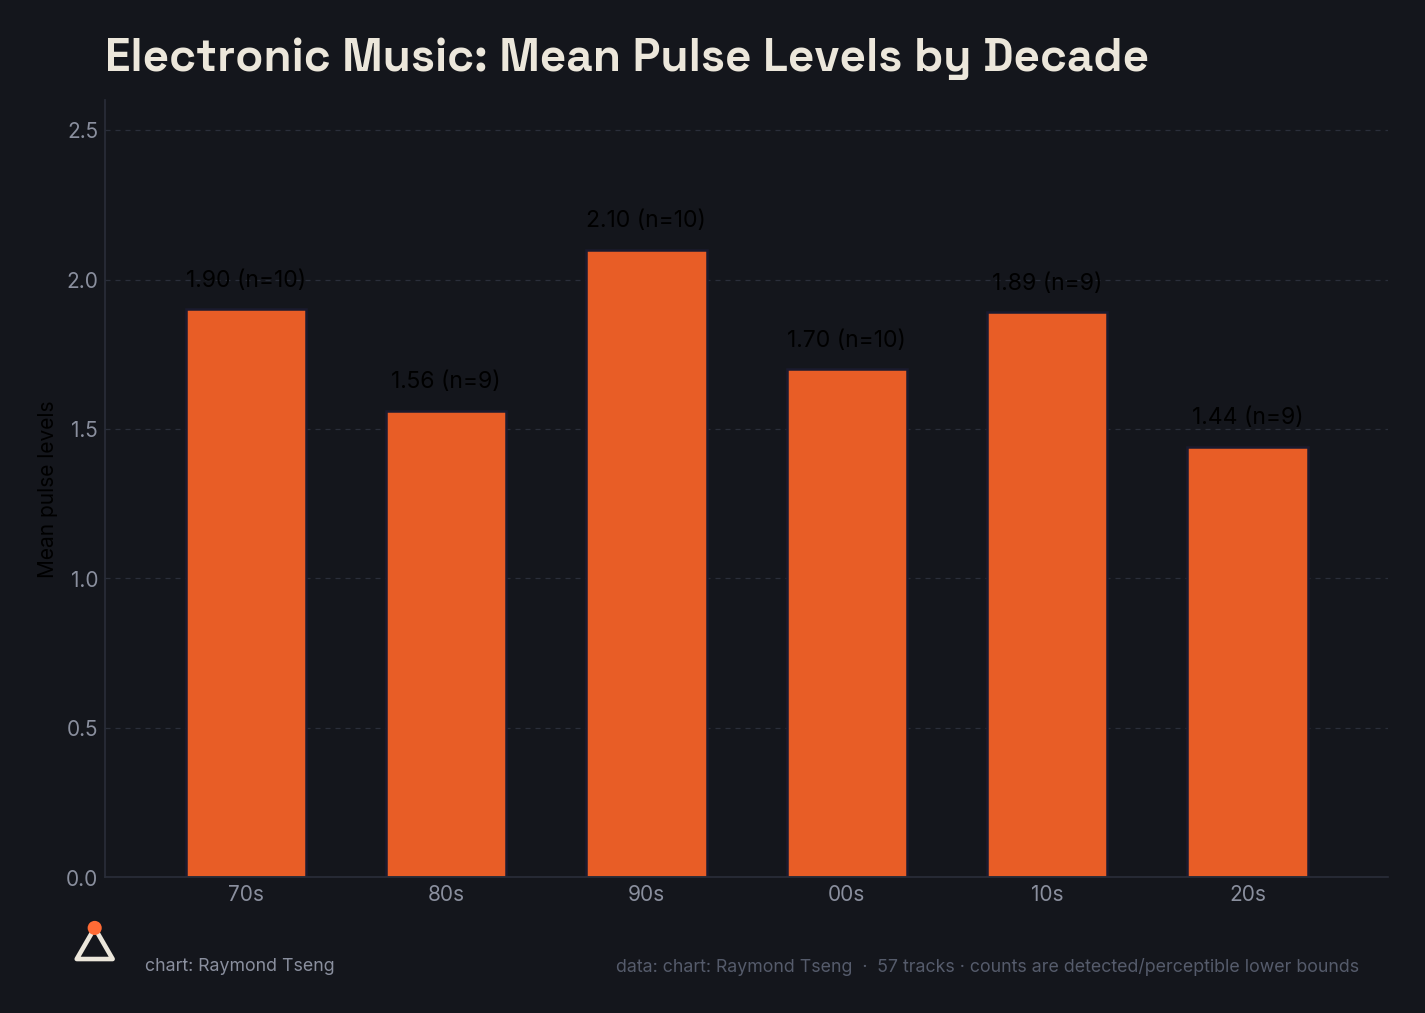
Electronic Music: Mean Pulse Levels by Decade
Electronic pulse density peaked in the 90s and fell to its leanest in the 2020s (57 tracks).
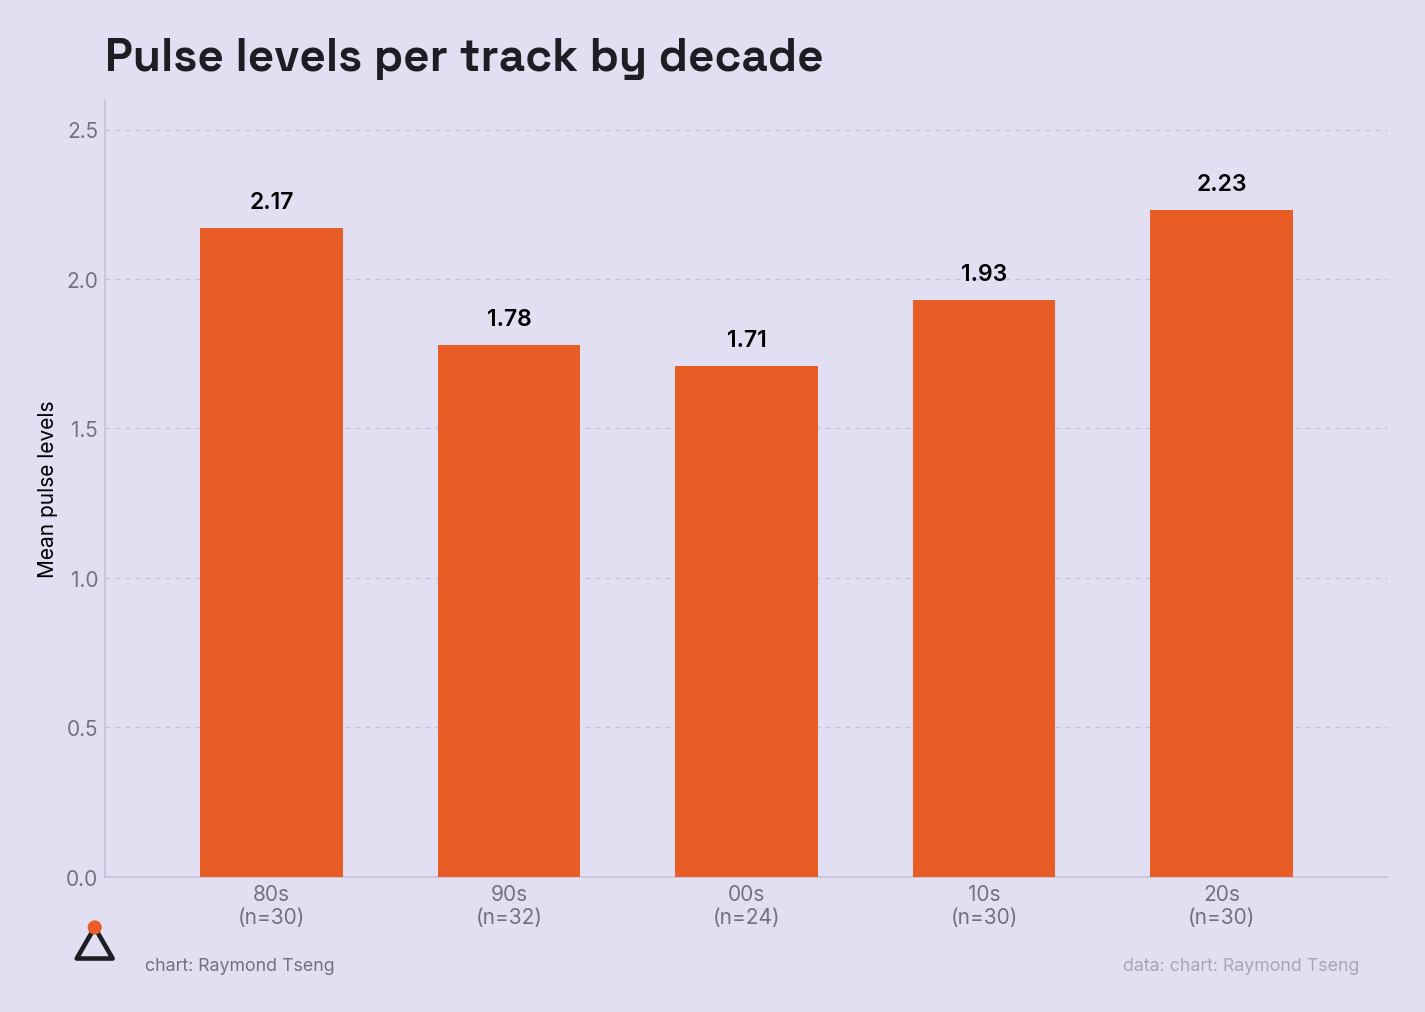
Pulse levels per track by decade
Rap's rhythmic density is U-shaped: busiest in the 80s and 2020s, sparsest in the 2000s (146 tracks).
Demography
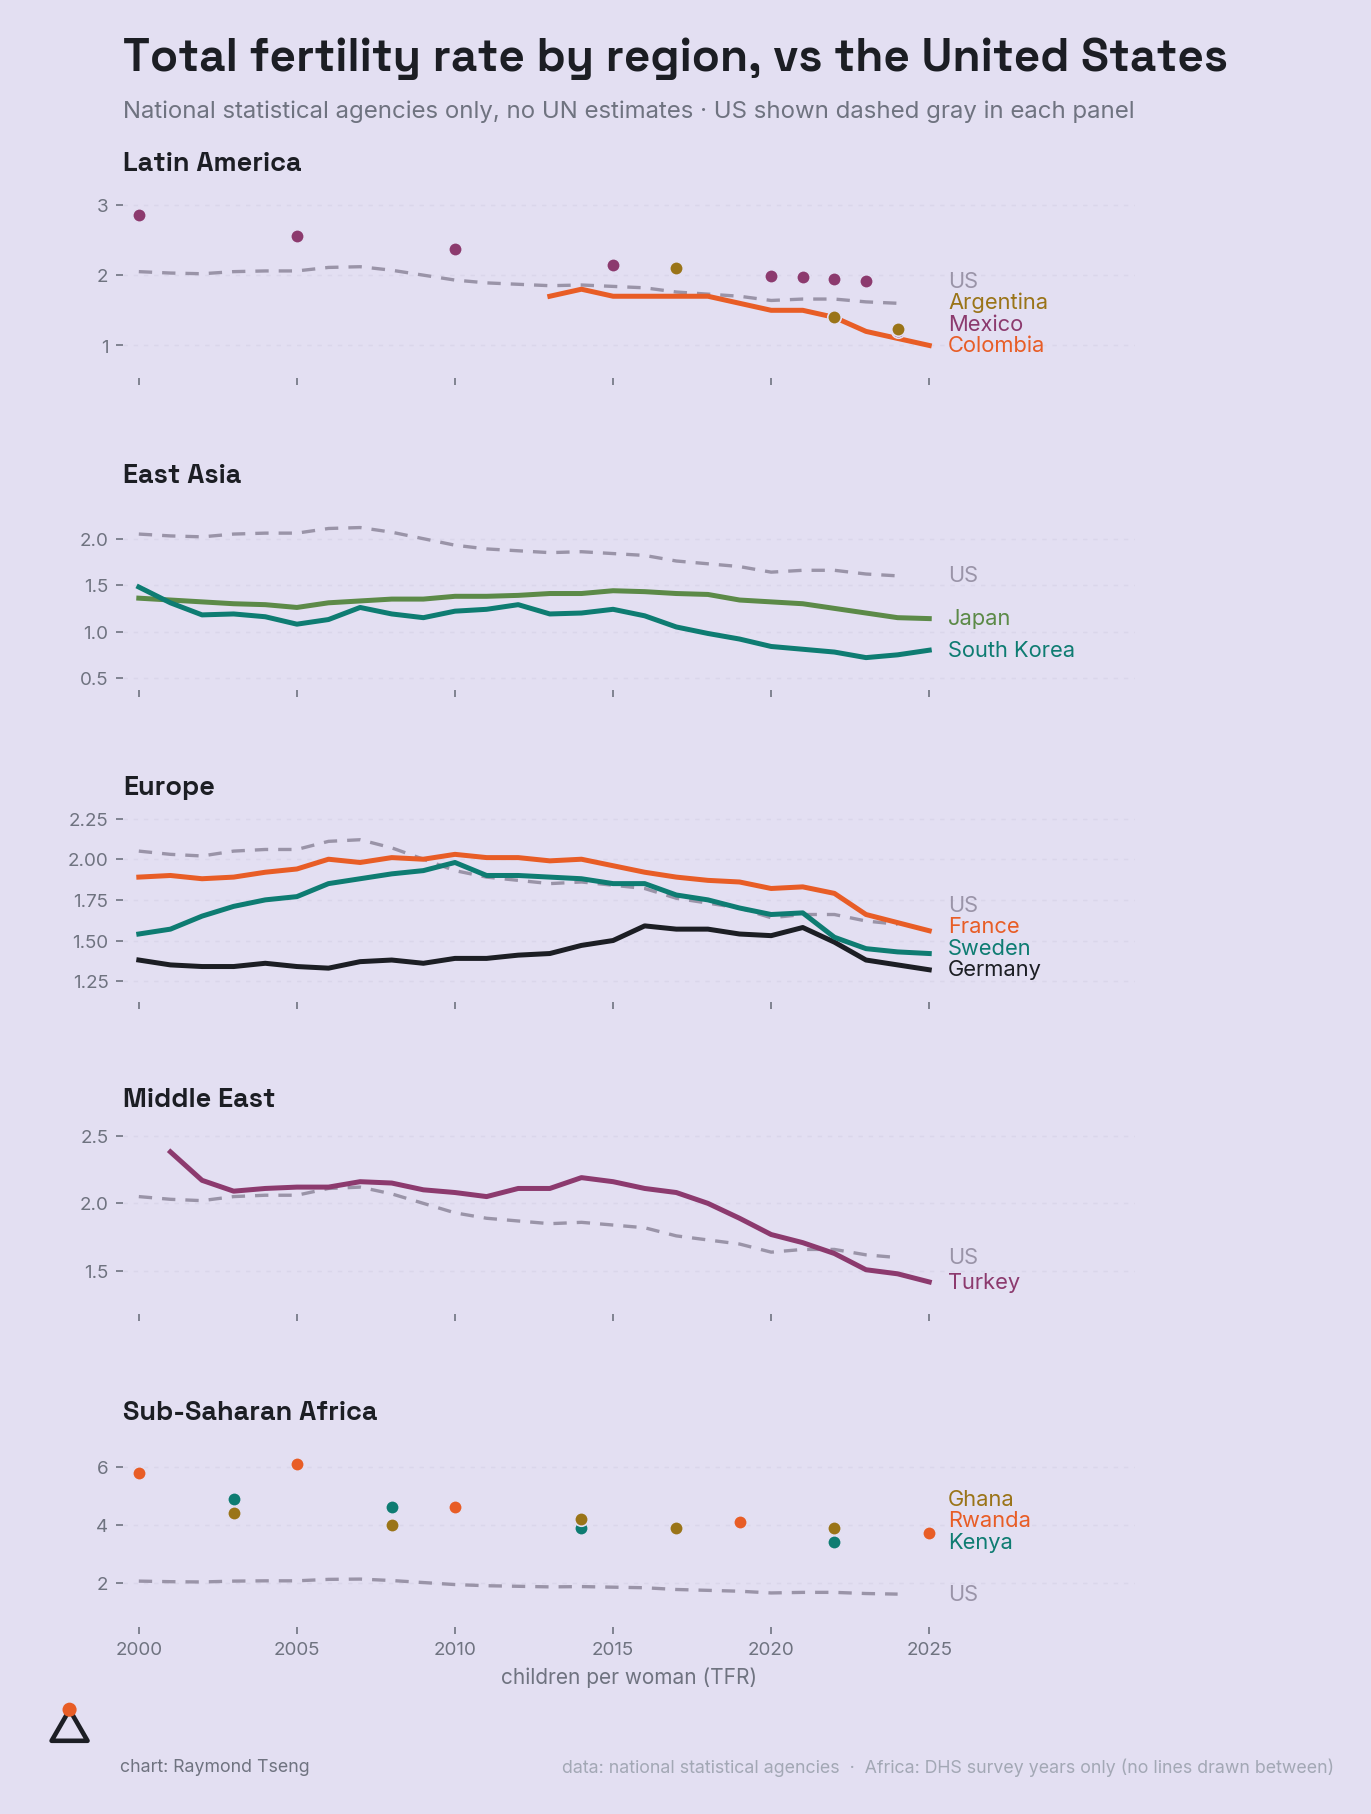
Total fertility rate by region, vs the United States
Each region against the US (dashed gray), from national statistical agencies only — no UN estimates. Turkey fell from 2.4 to 1.4; France from 1.9 to 1.6; Rwanda from 5.8 to 3.7. Latin America now sits below the US.
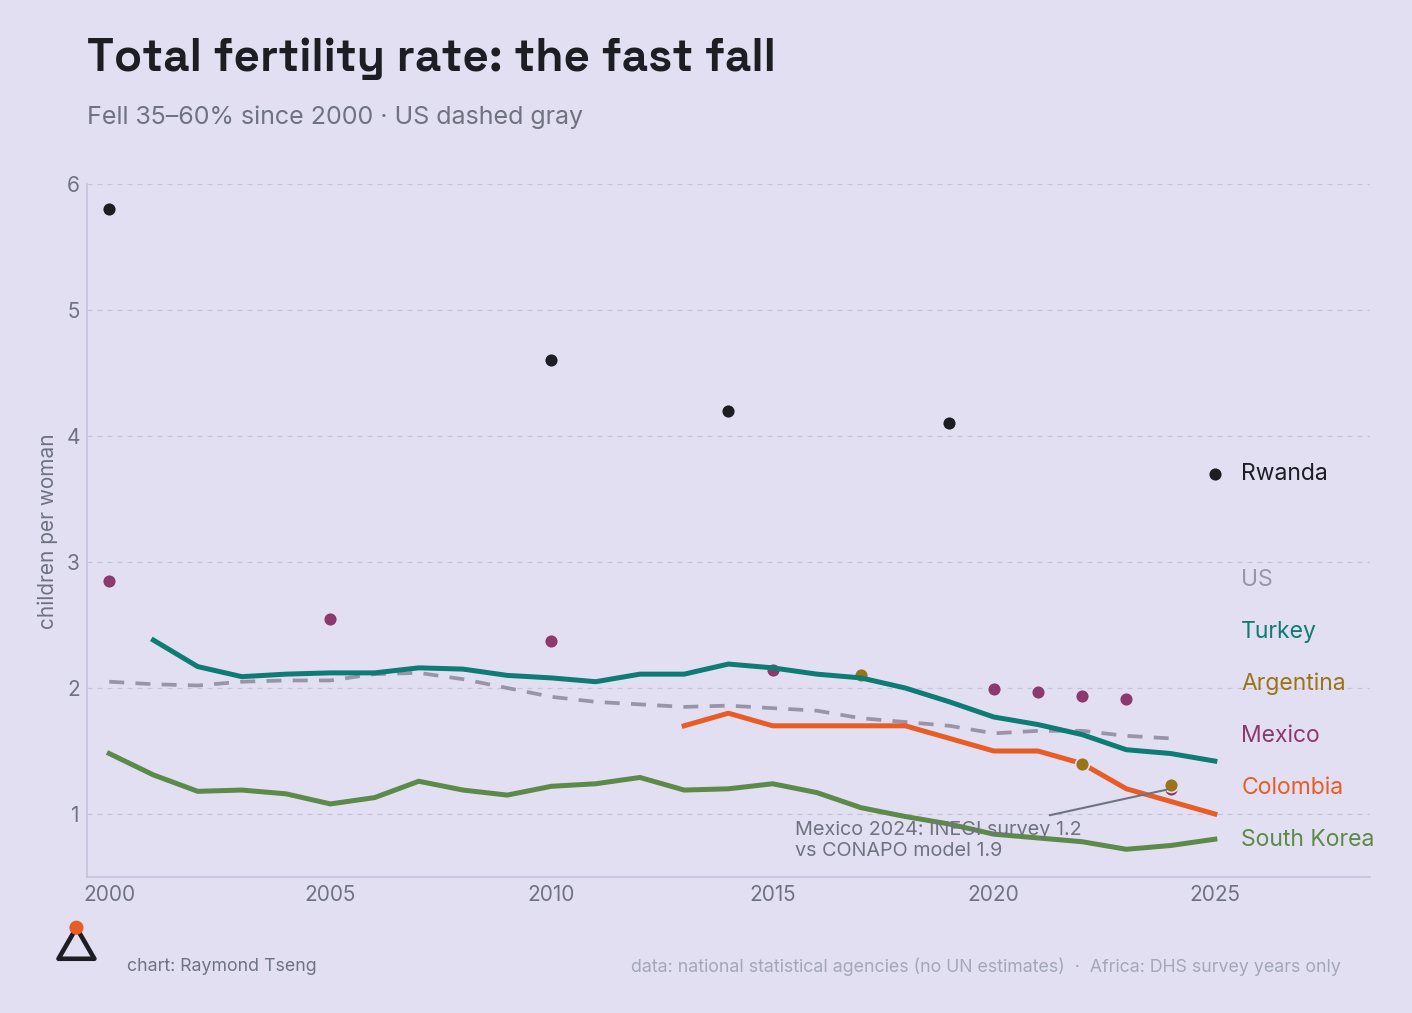
Total fertility rate: the fast fall
Colombia, Mexico, Argentina, Turkey, South Korea, Rwanda — down 35–60% since 2000 — against the US (dashed gray). Mexico's 2024 INEGI survey (1.2) sits far below CONAPO's model (1.9).
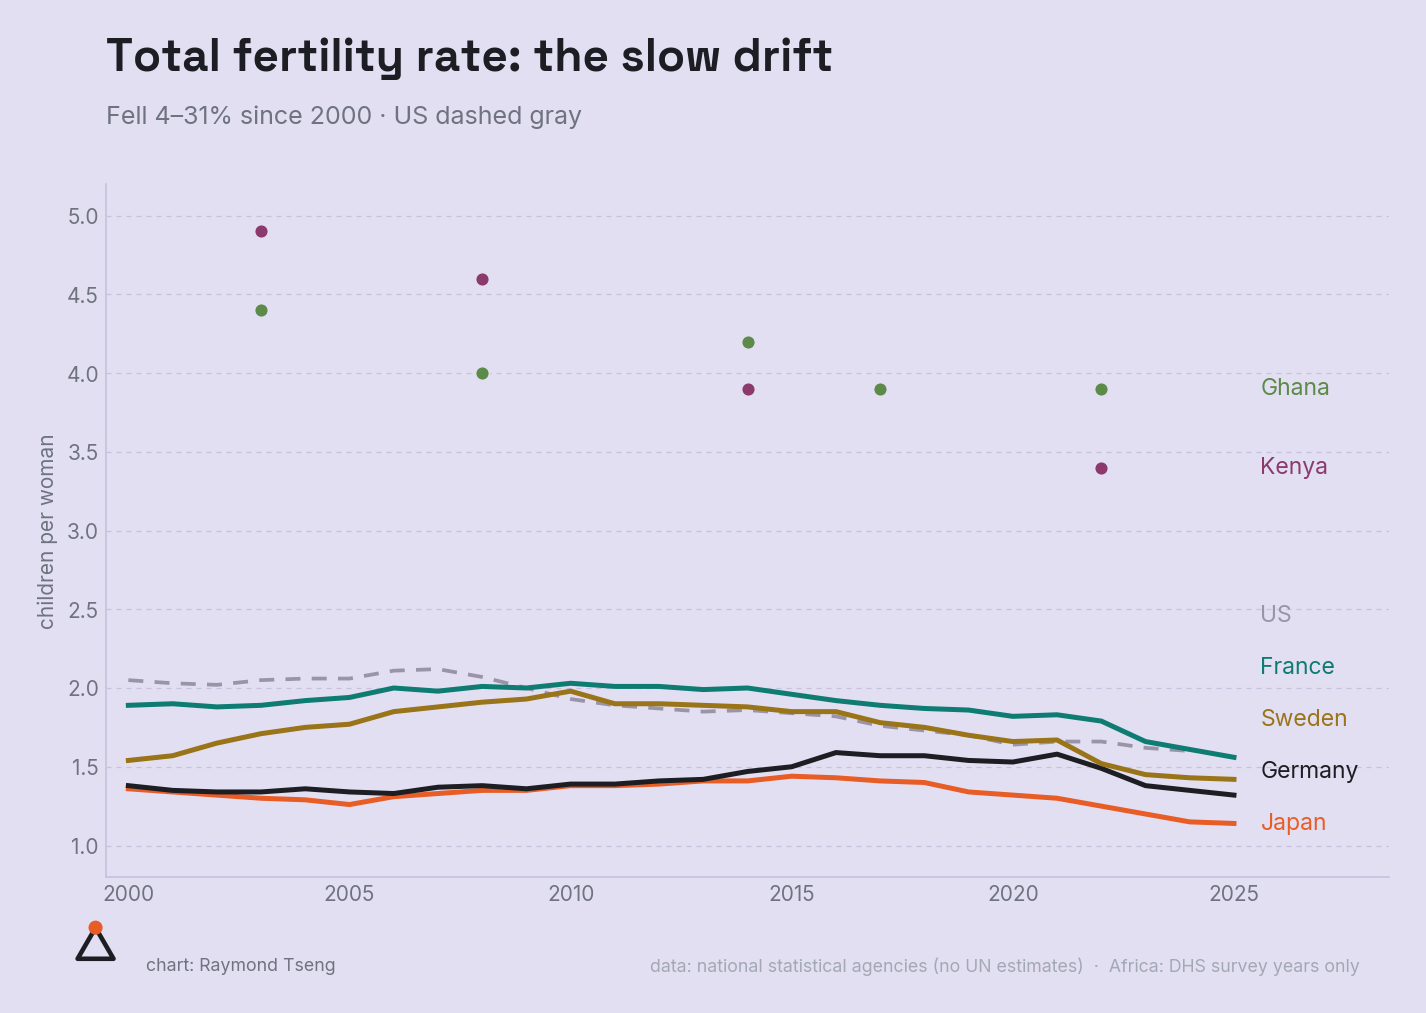
Total fertility rate: the slow drift
Japan, Germany, France, Sweden, Kenya, Ghana — down 4–31% since 2000 — against the US (dashed gray). Same direction as the fast fallers, slower speed.
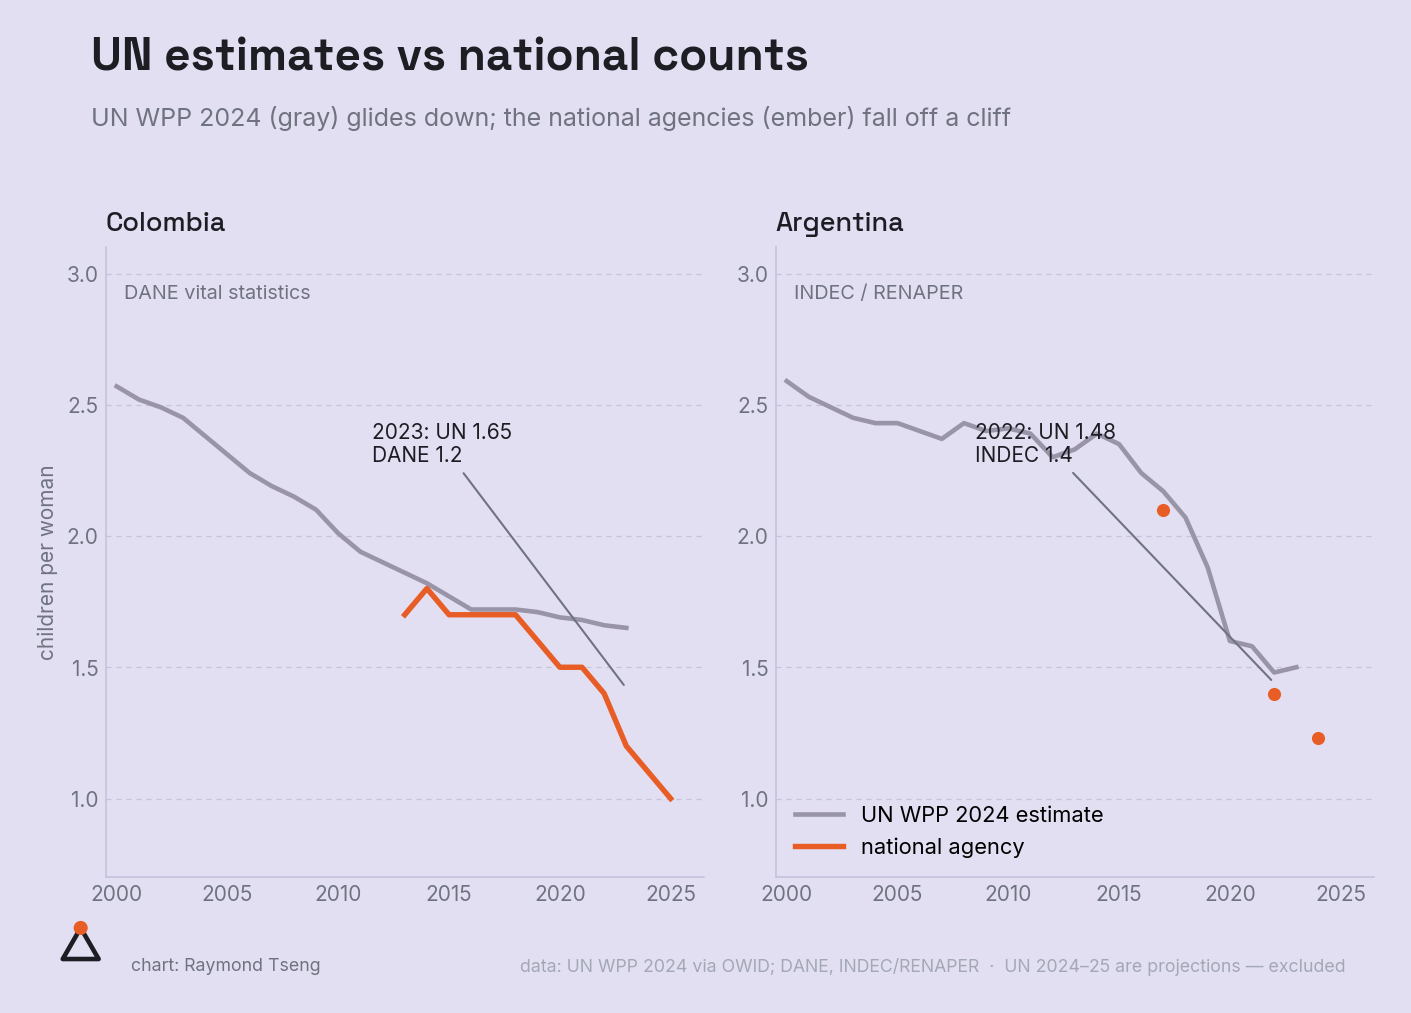
UN estimates vs national counts
The UN's WPP 2024 estimates (gray) glide gently down while the national agencies (ember) fall off a cliff. Colombia 2023: UN 1.65 vs DANE 1.2.
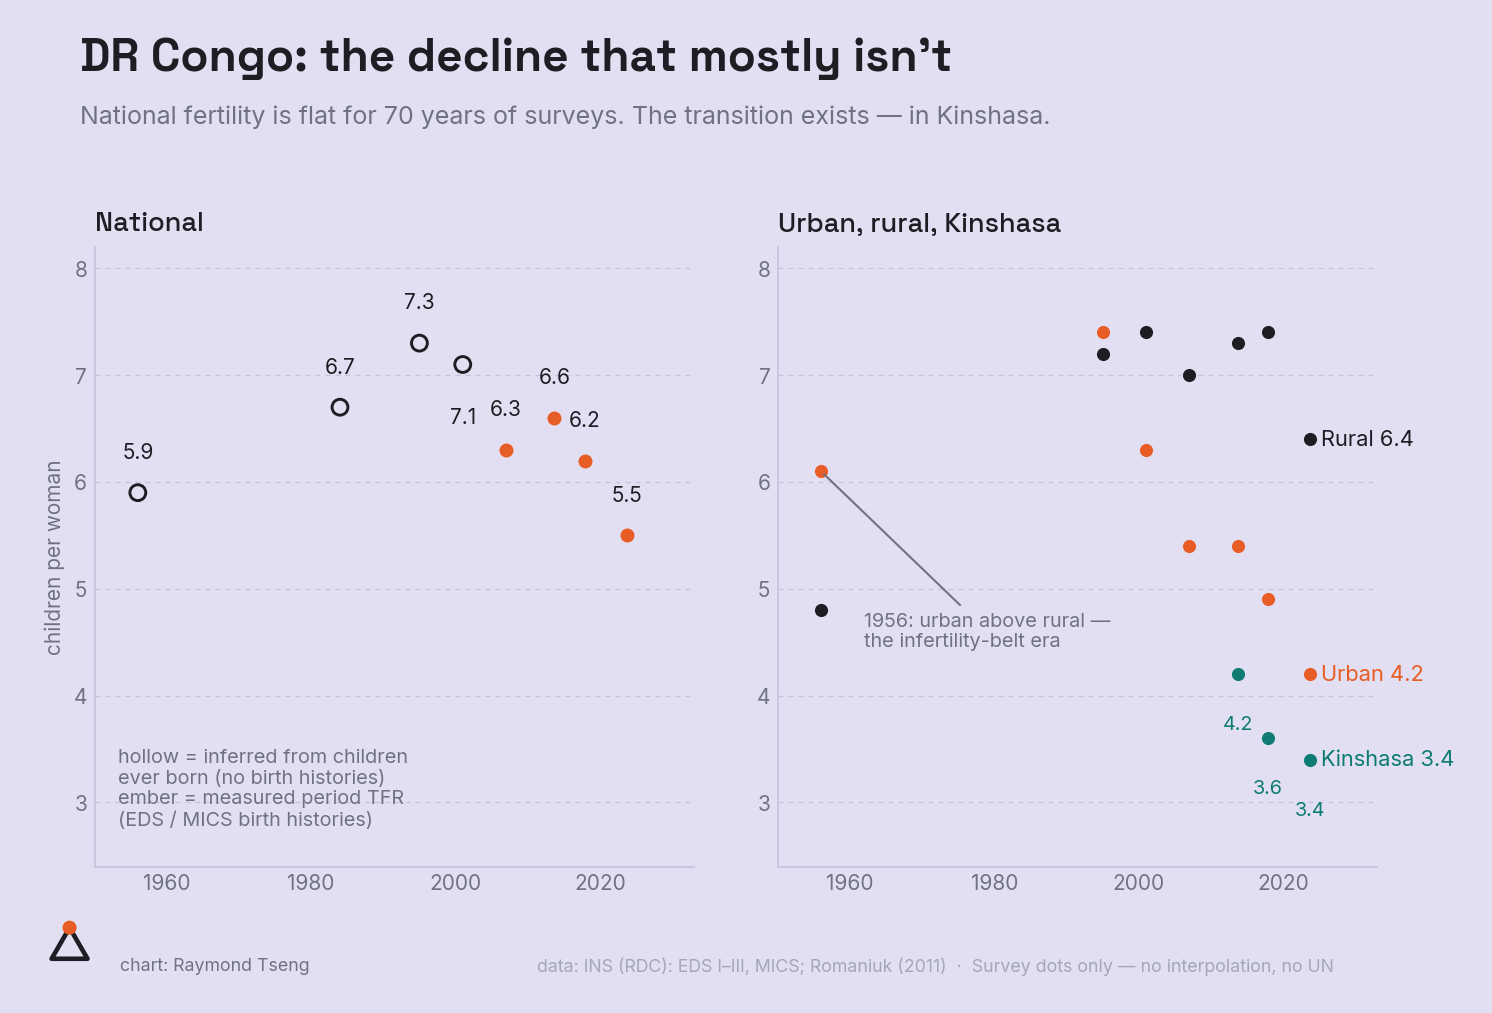
DR Congo: the decline that mostly isn't
National fertility is flat across 70 years of surveys — 5.5 in 2023–24 is the first real downtick. Kinshasa is the exception: 4.2 → 3.6 → 3.4. (INS surveys only; last census 1984.)
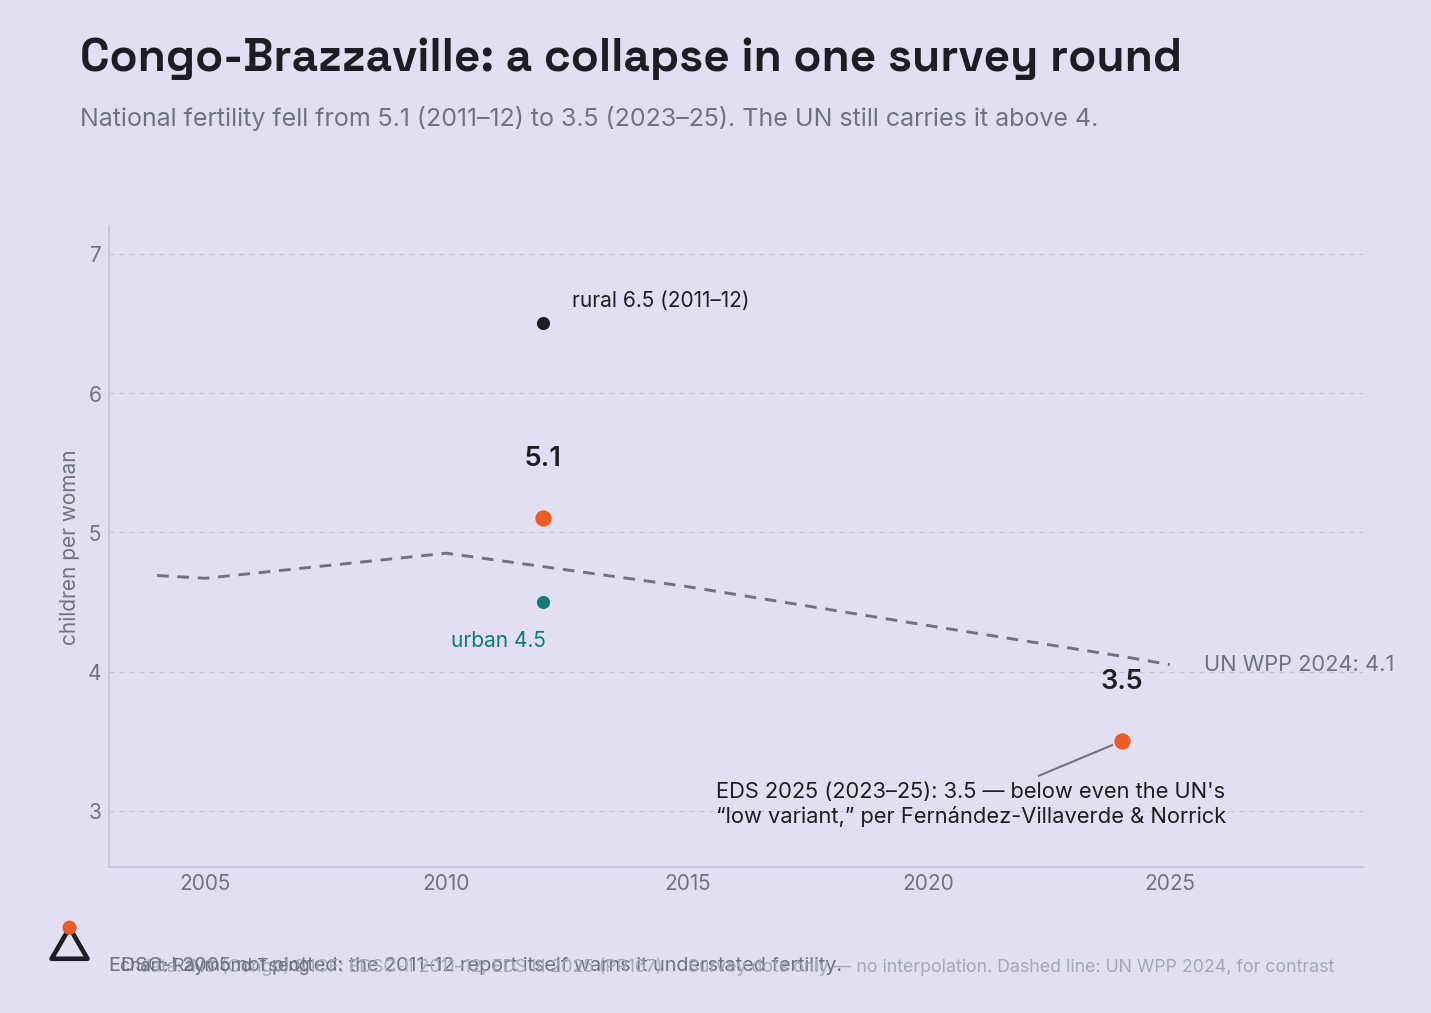
Congo-Brazzaville: a collapse in one survey round
5.1 (2011–12) → 3.5 (2023–25) in the national surveys — below the UN's low variant, while the UN still shows 4.1. This is the Congo Fernández-Villaverde cites. (INS & ICF, DHS.)
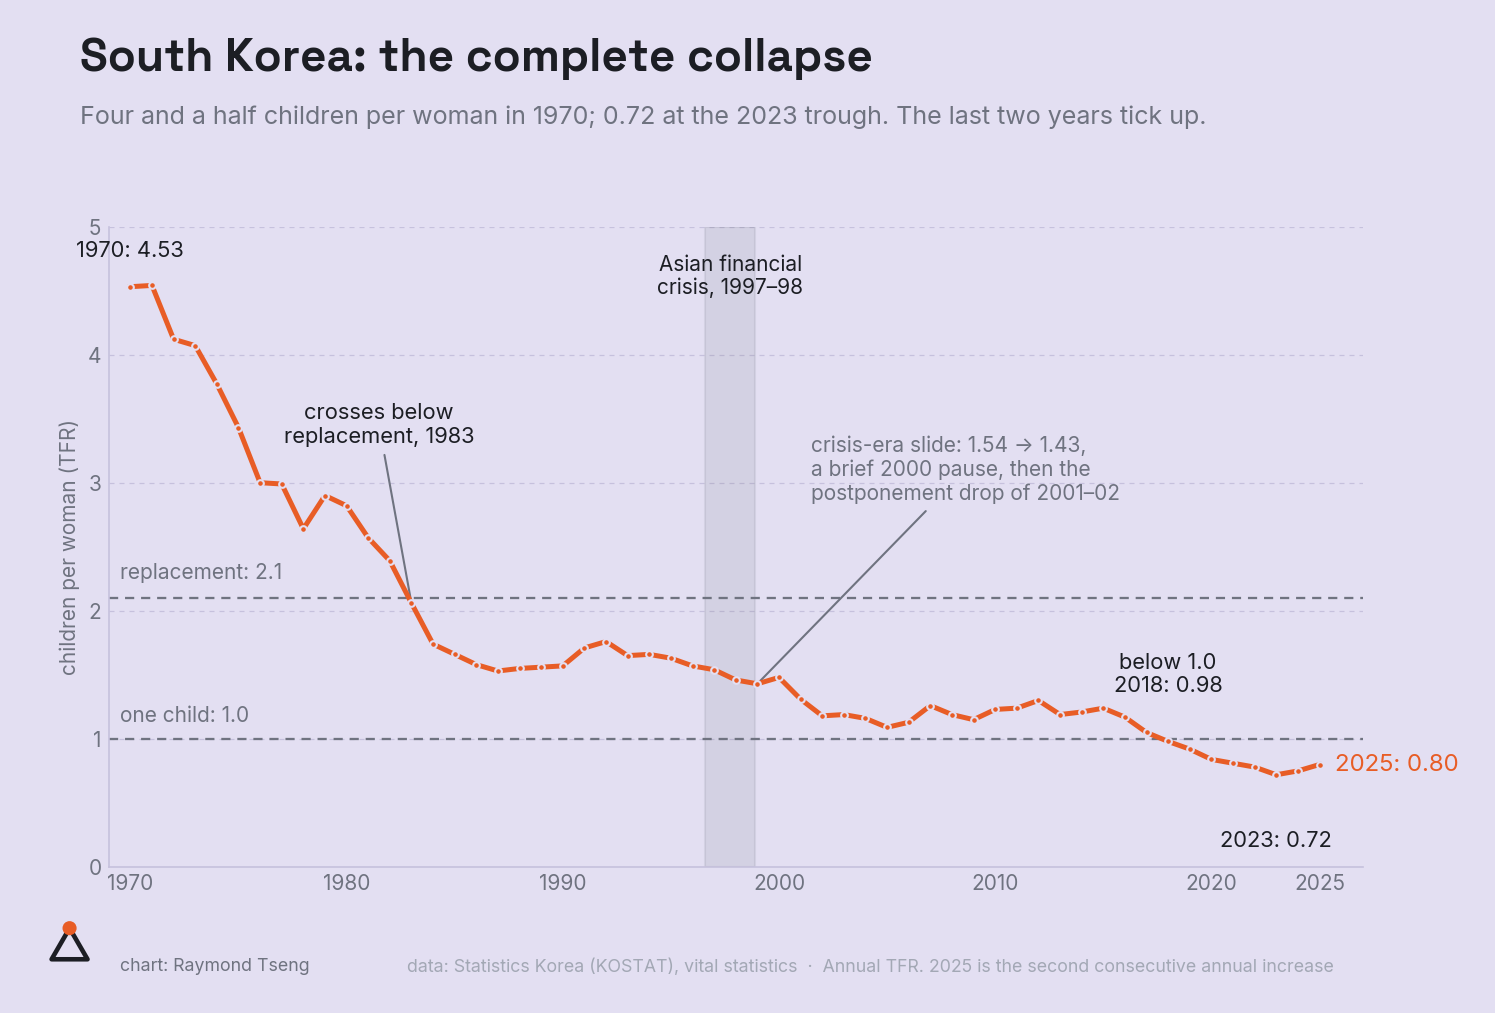
South Korea: the complete collapse
TFR 4.53 in 1970 → 0.72 in 2023 → 0.80 in 2025 (KOSTAT). Below replacement since 1983, below one child since 2018 — with the Asian financial crisis shaded.
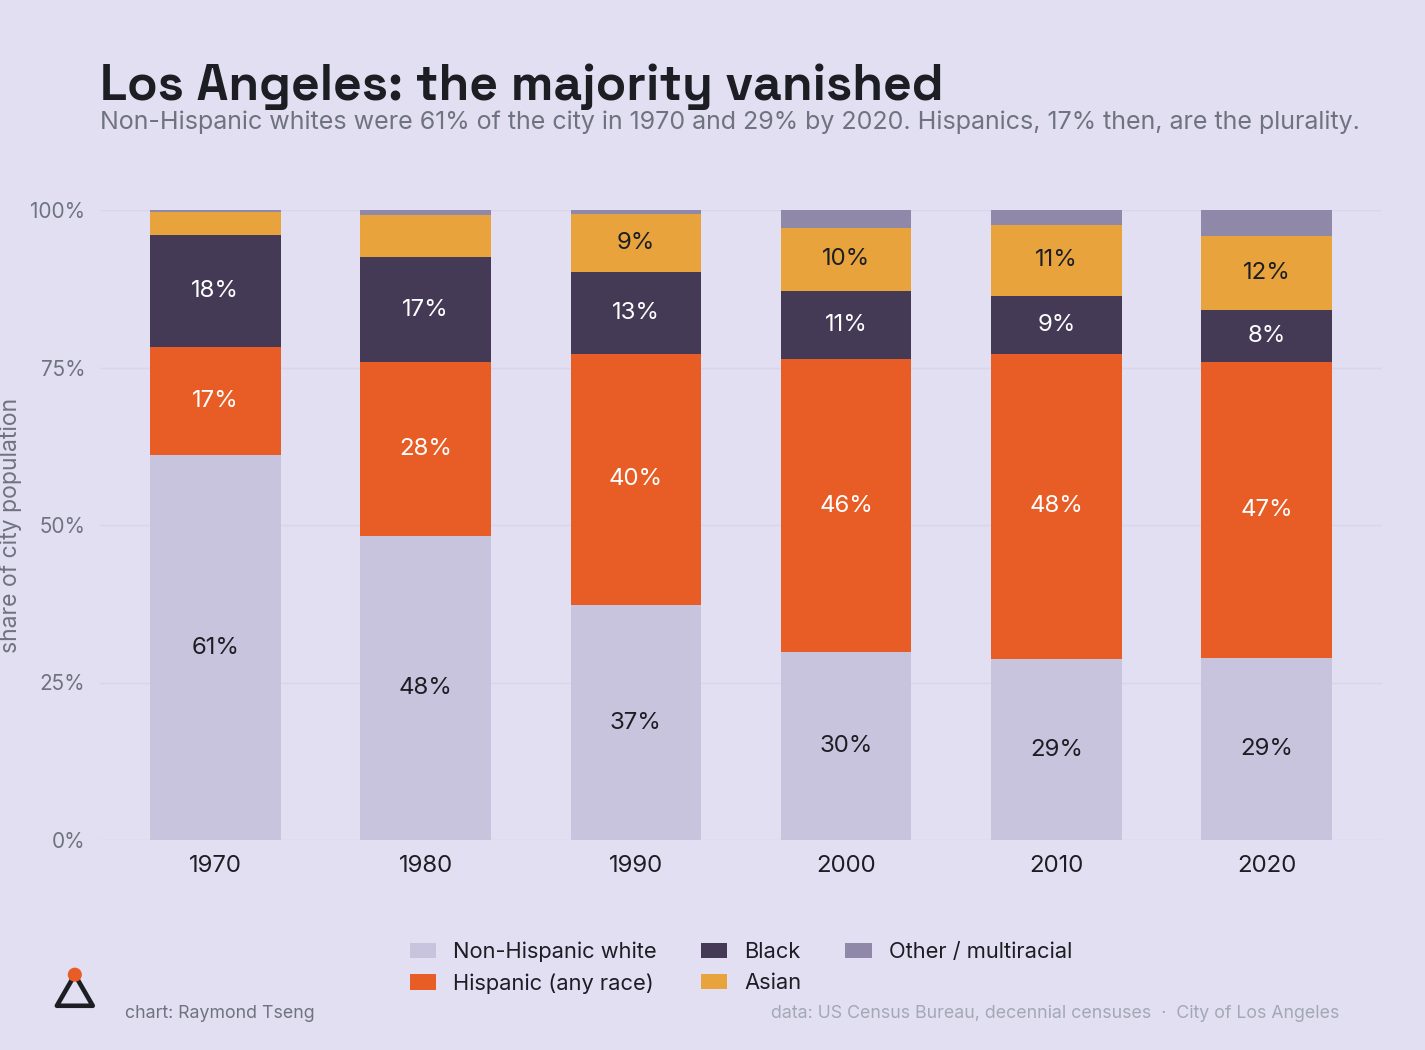
Los Angeles: the majority vanished
City of Los Angeles, 1970–2020: non-Hispanic whites 61% → 29%, Hispanics 17% → 47%, Black share halved, Asian share tripled.
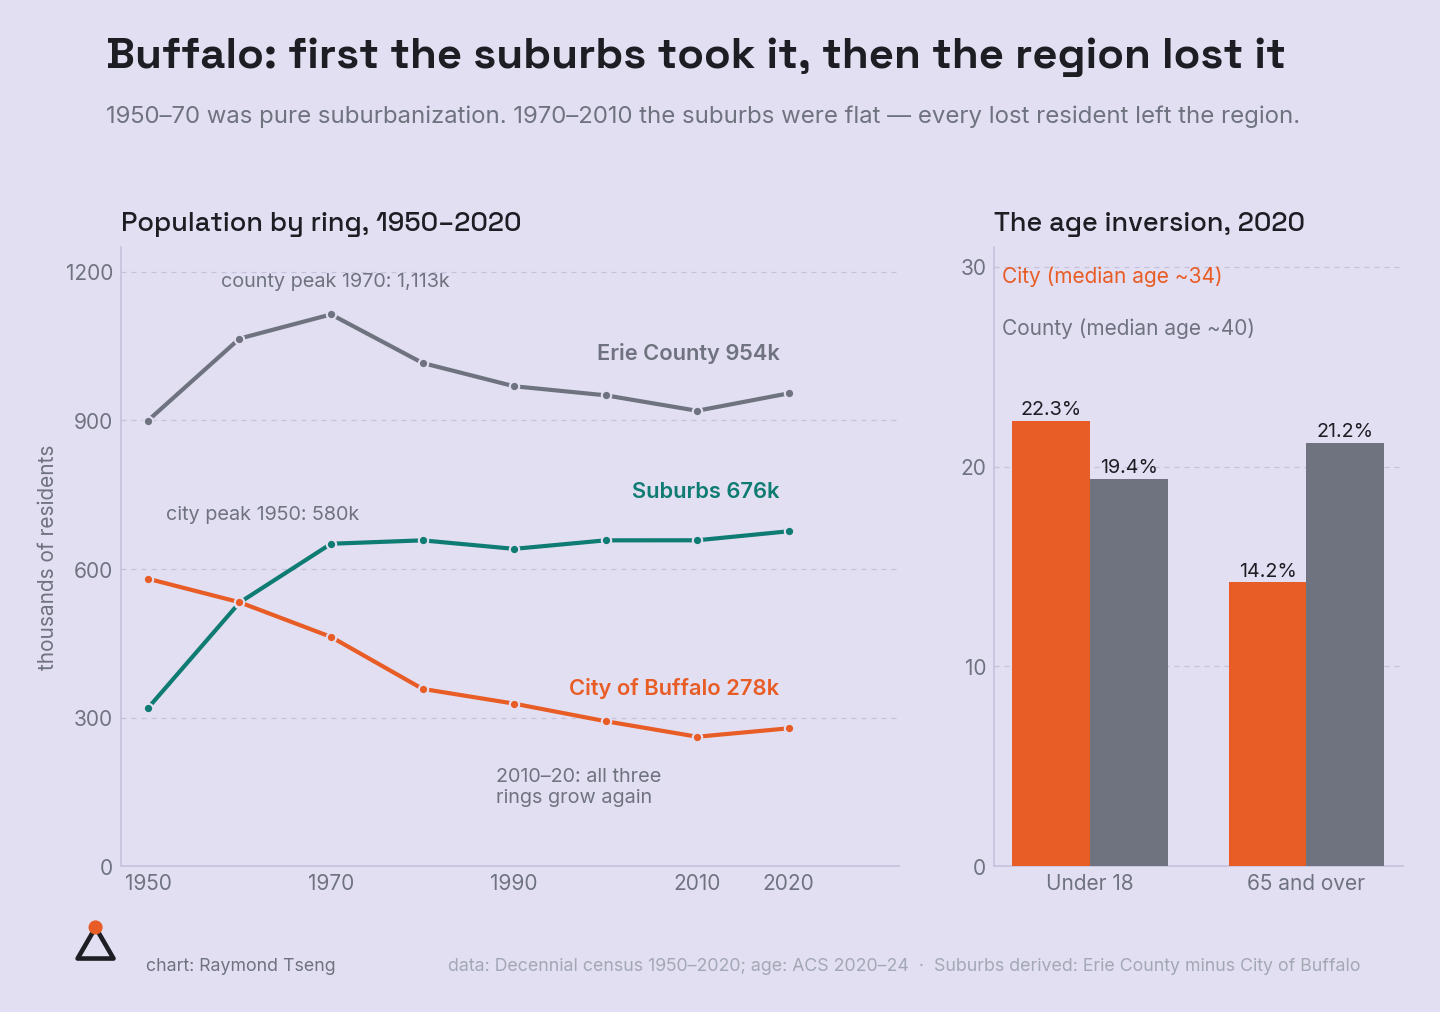
Buffalo: first the suburbs took it, then the region lost it
City 580k (1950) → 278k (2020); county peaked at 1,113k in 1970. After 1970 the suburbs stopped absorbing — the decline was real. The city is now the young ring; the retirees are in the suburbs.
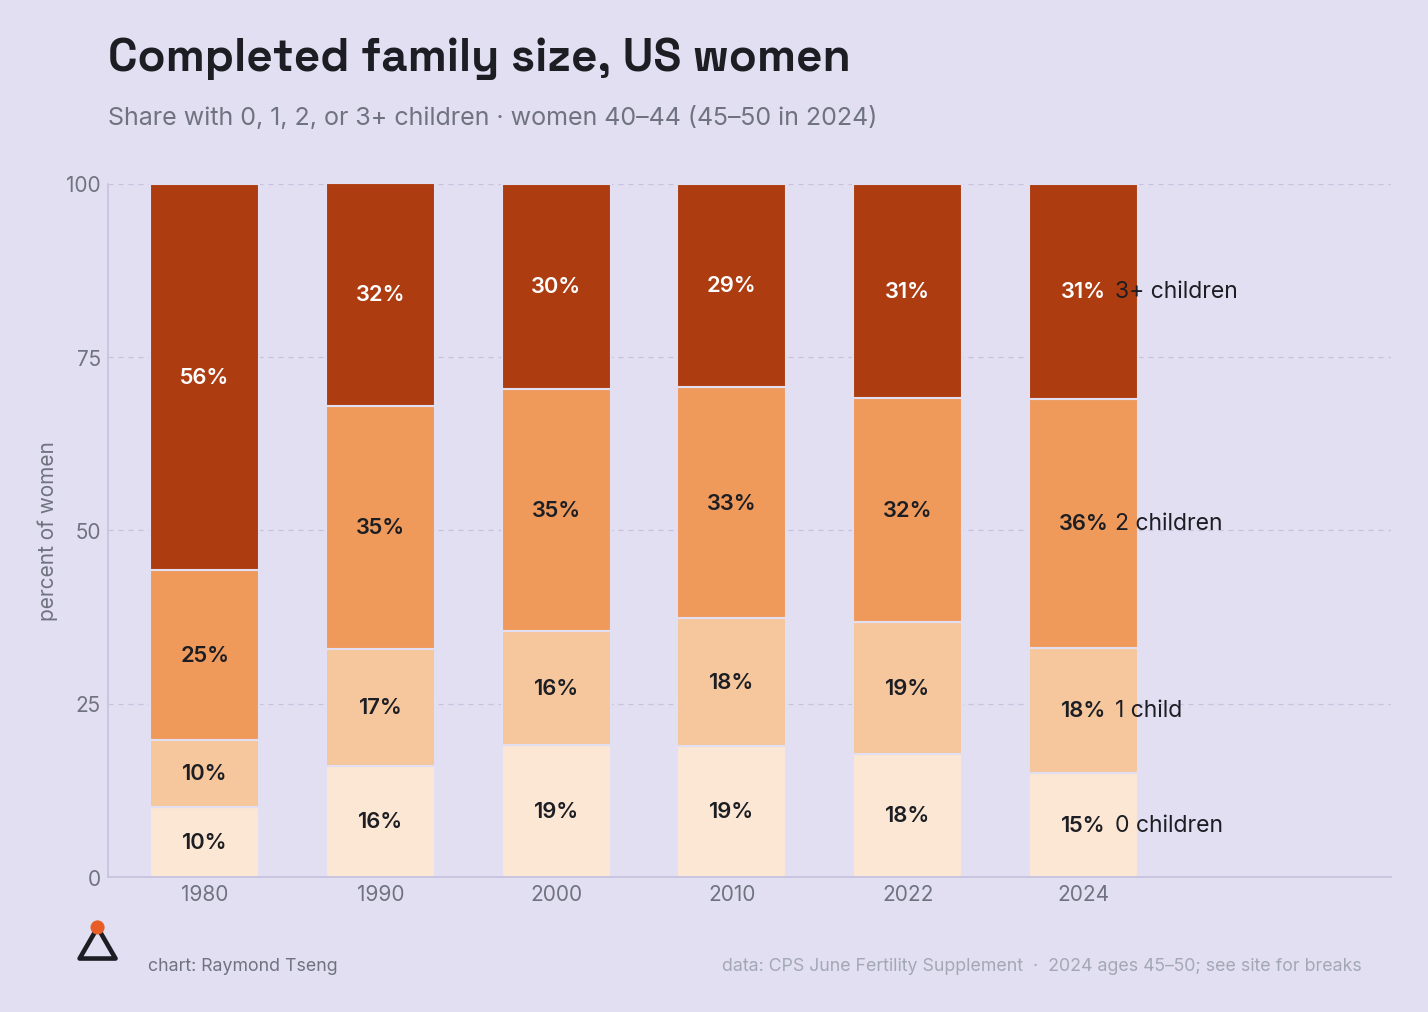
Completed family size, US women
The 3+ child family collapsed: 56% of women 40–44 had 3+ children in 1980, 31% in 2024 — while childlessness went 10% to 15%. (CPS June Fertility Supplement; 2024 is ages 45–50.)
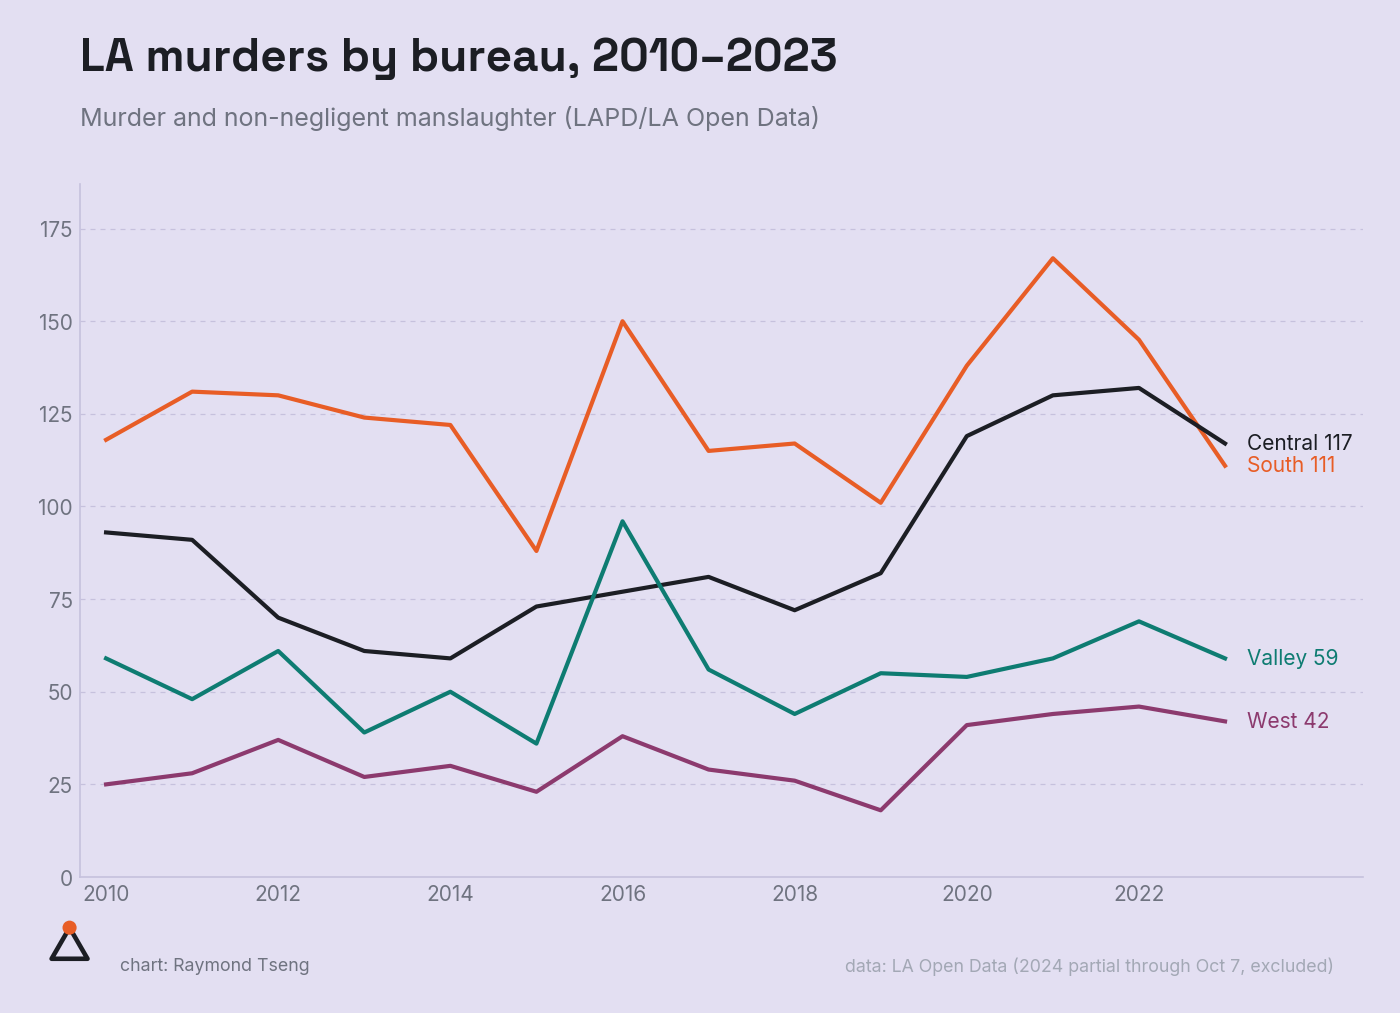
LA murders by bureau, 2010–2023
The 2020–22 spike was a South and Central bureau story — Central nearly doubled from 82 in 2019 to 132 in 2022; Valley and West barely moved (LA Open Data; 2024 partial, excluded).
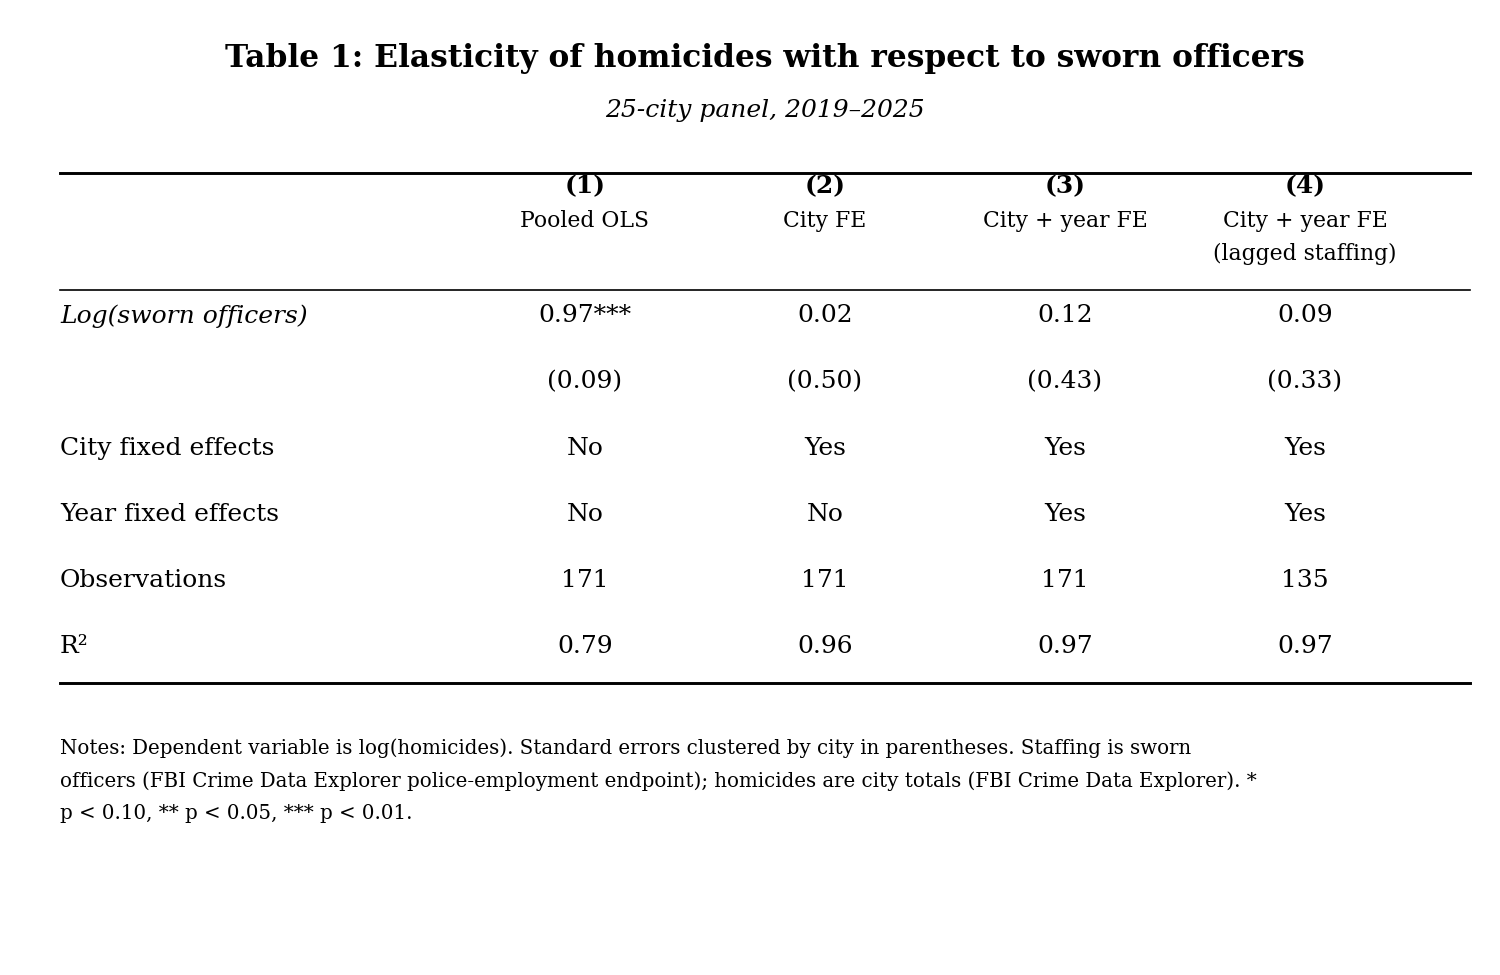
Did police staffing losses cause the homicide wave?
Research note: the full writeup with Table 1, the coefficient plot, and the timing chart — read it here or download the PDF.
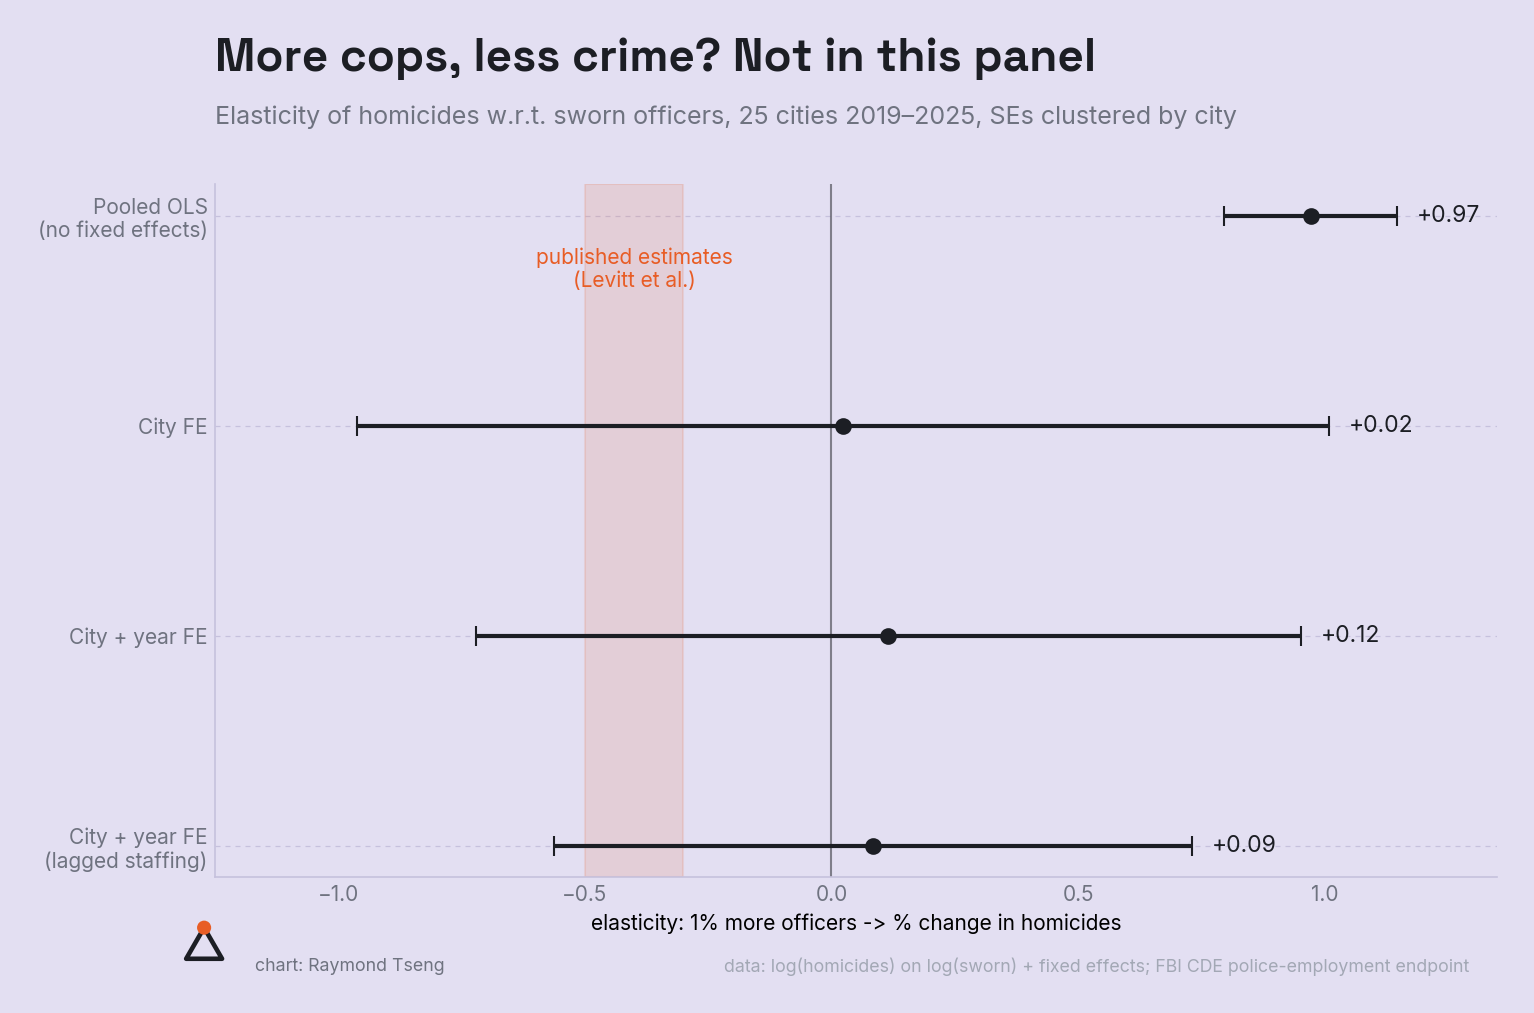
More cops, less crime? Not in this panel
Panel regression: elasticity of homicides w.r.t. sworn officers, 25 cities 2019–2025. Pooled OLS says +0.97 (bigger cities have more of both); with city and year fixed effects it's +0.12, statistically zero — nowhere near the published -0.3 to -0.5.
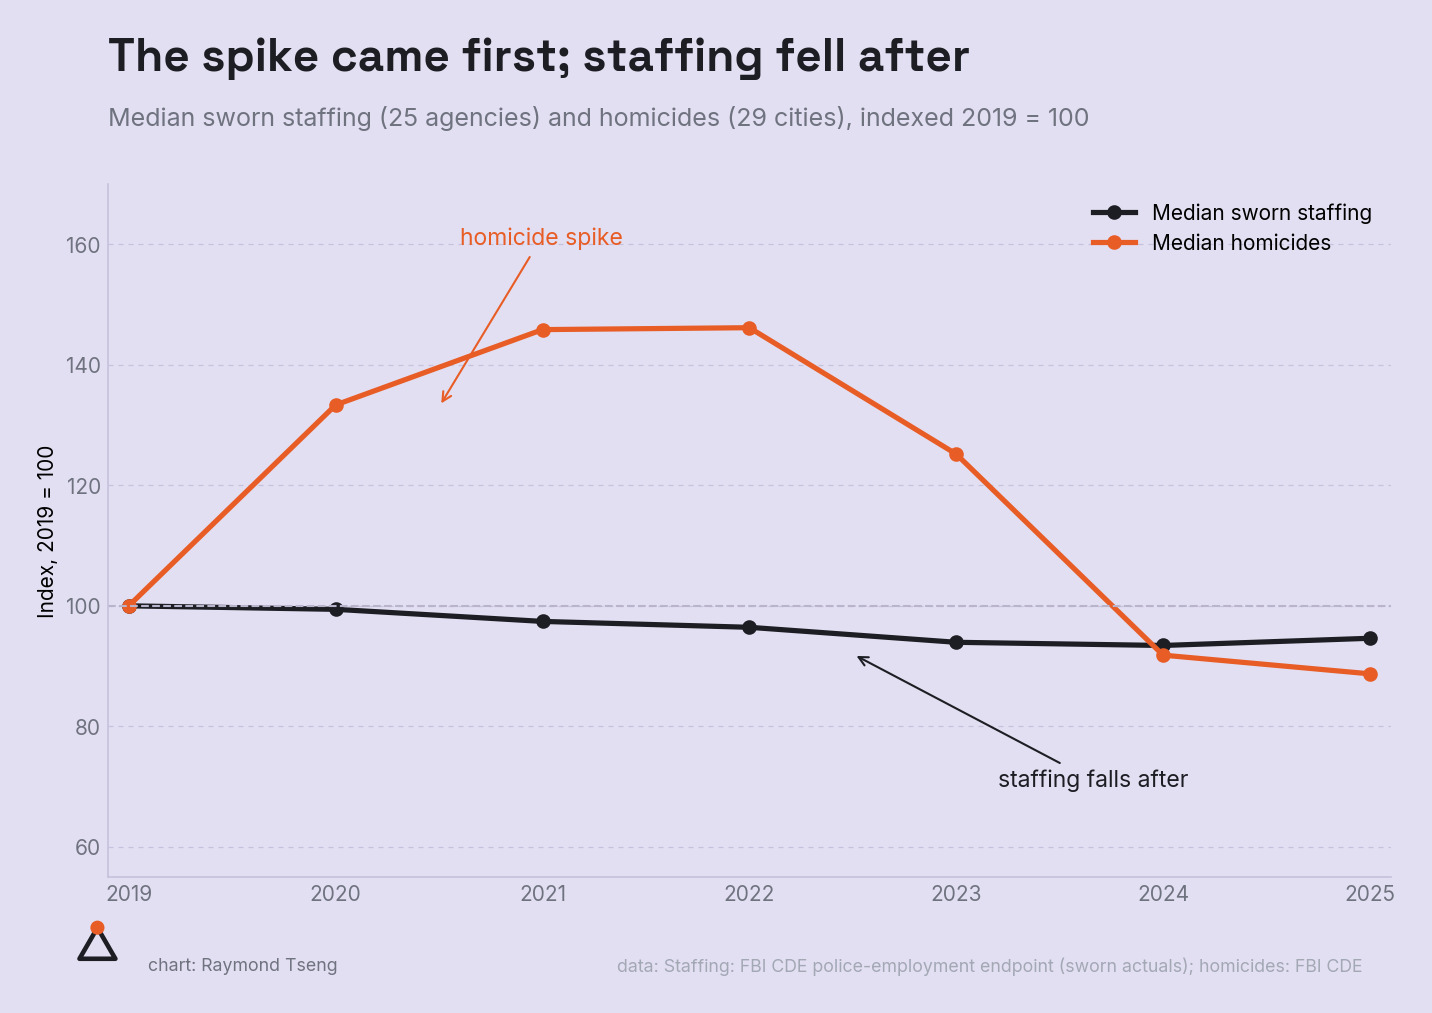
The spike came first; staffing fell after
Yearly sworn headcounts, 2019–2025. Median staffing was flat while homicides spiked +33% in 2020; the staffing decline (2021–24) came after, as homicides were already falling.
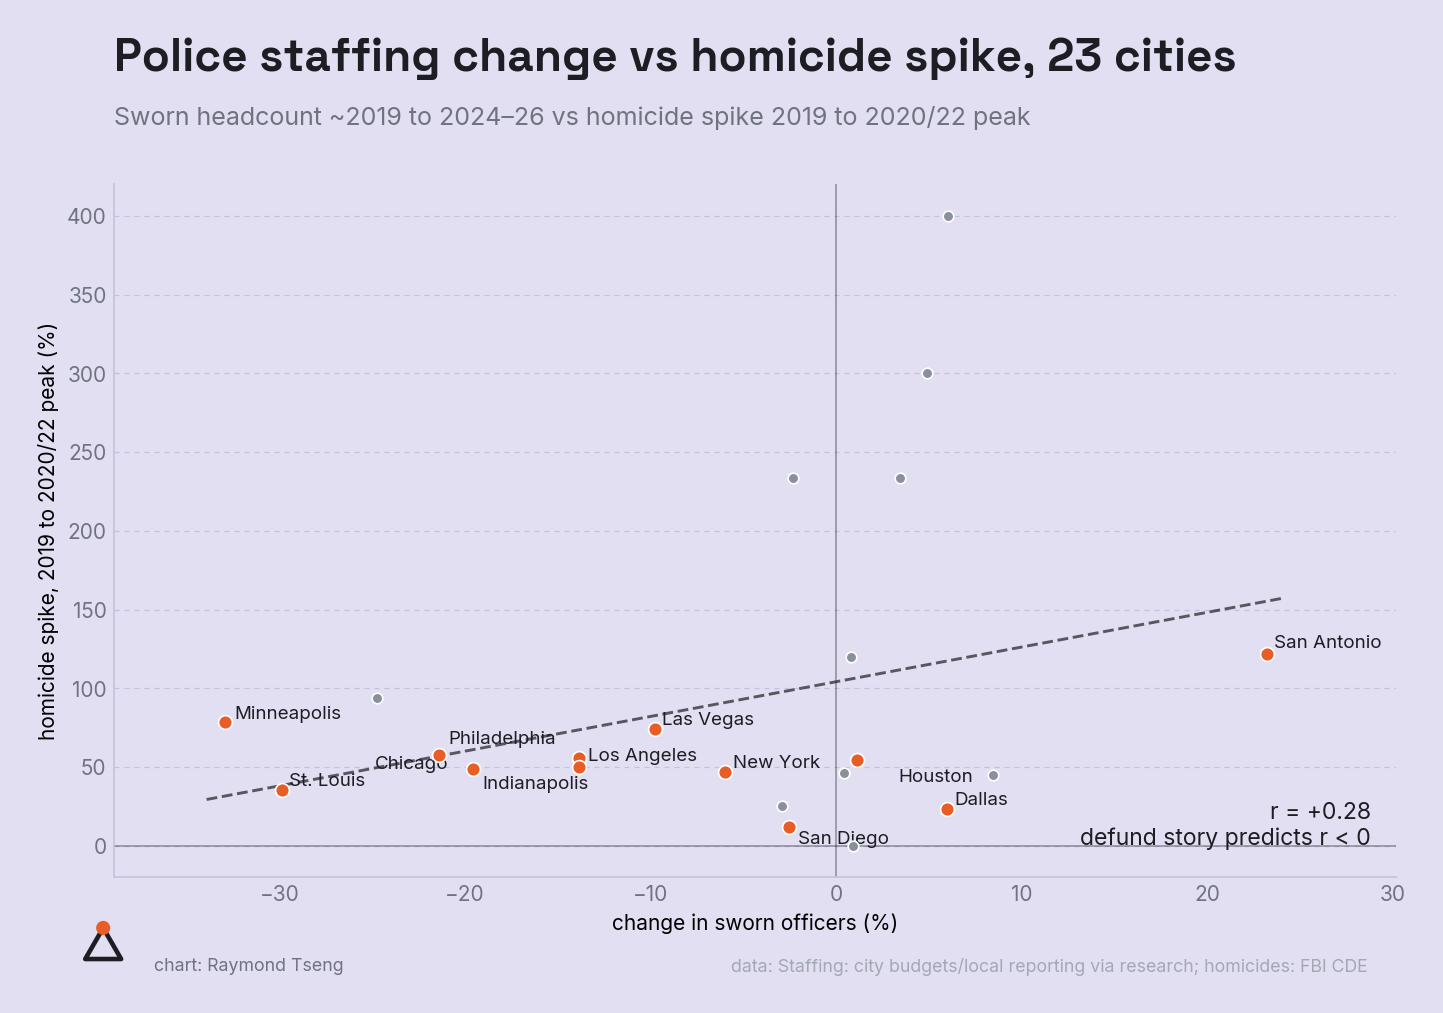
Police staffing change vs homicide spike, 23 cities
Sworn headcount change (~2019 to 2024–26) vs homicide spike (2019 to 2020/22 peak): r = +0.28. The defund story predicts a negative correlation — it isn't there.
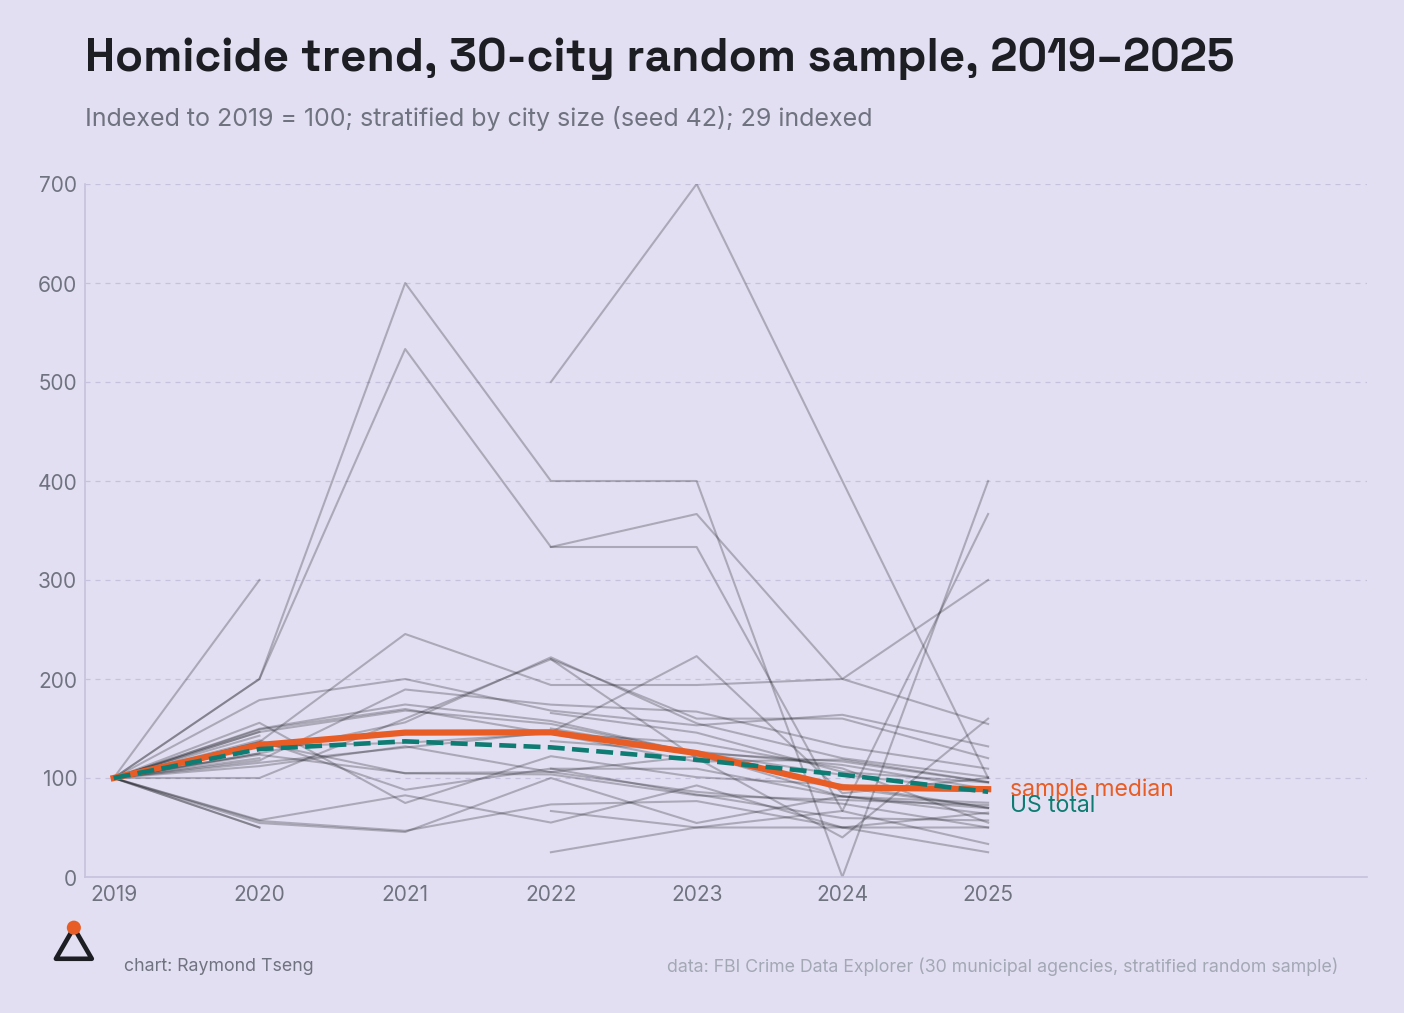
Homicide trend, 30-city random sample, 2019–2025
Indexed to 2019 = 100. The random sample's median tracks the US total — the wave wasn't an artifact of picking famous cities. 18 of 29 are below 2019 levels.
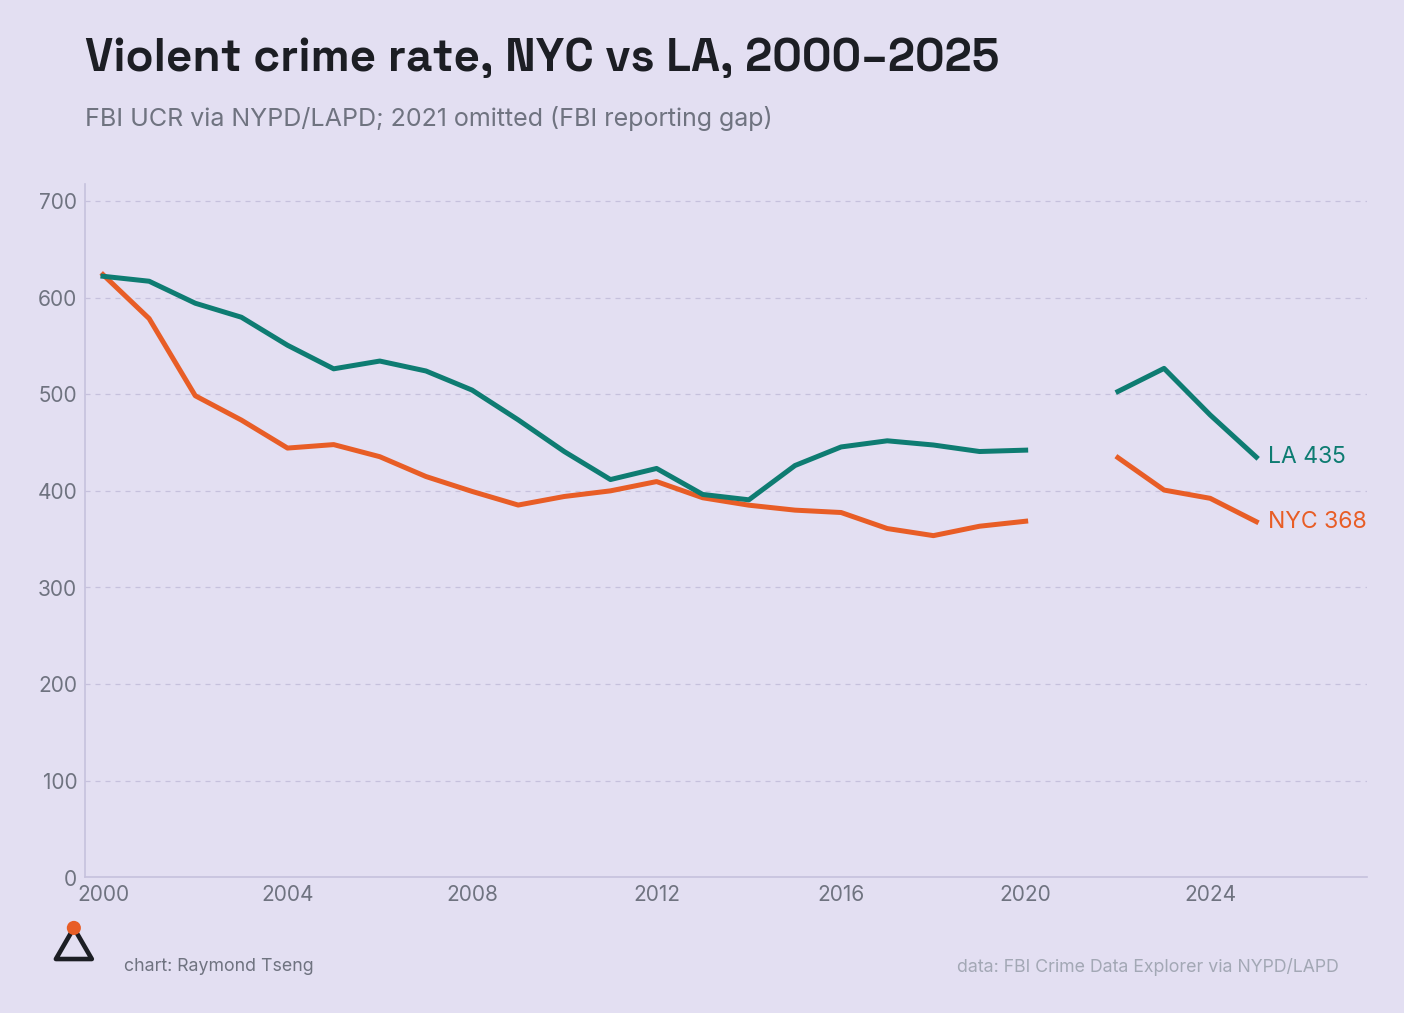
Violent crime rate, NYC vs LA, 2000–2025
Per 100k residents (FBI UCR). Note NYC's violent rate barely moved in 2020 — the homicide spike was offset by falling robbery; the jump came in 2022.
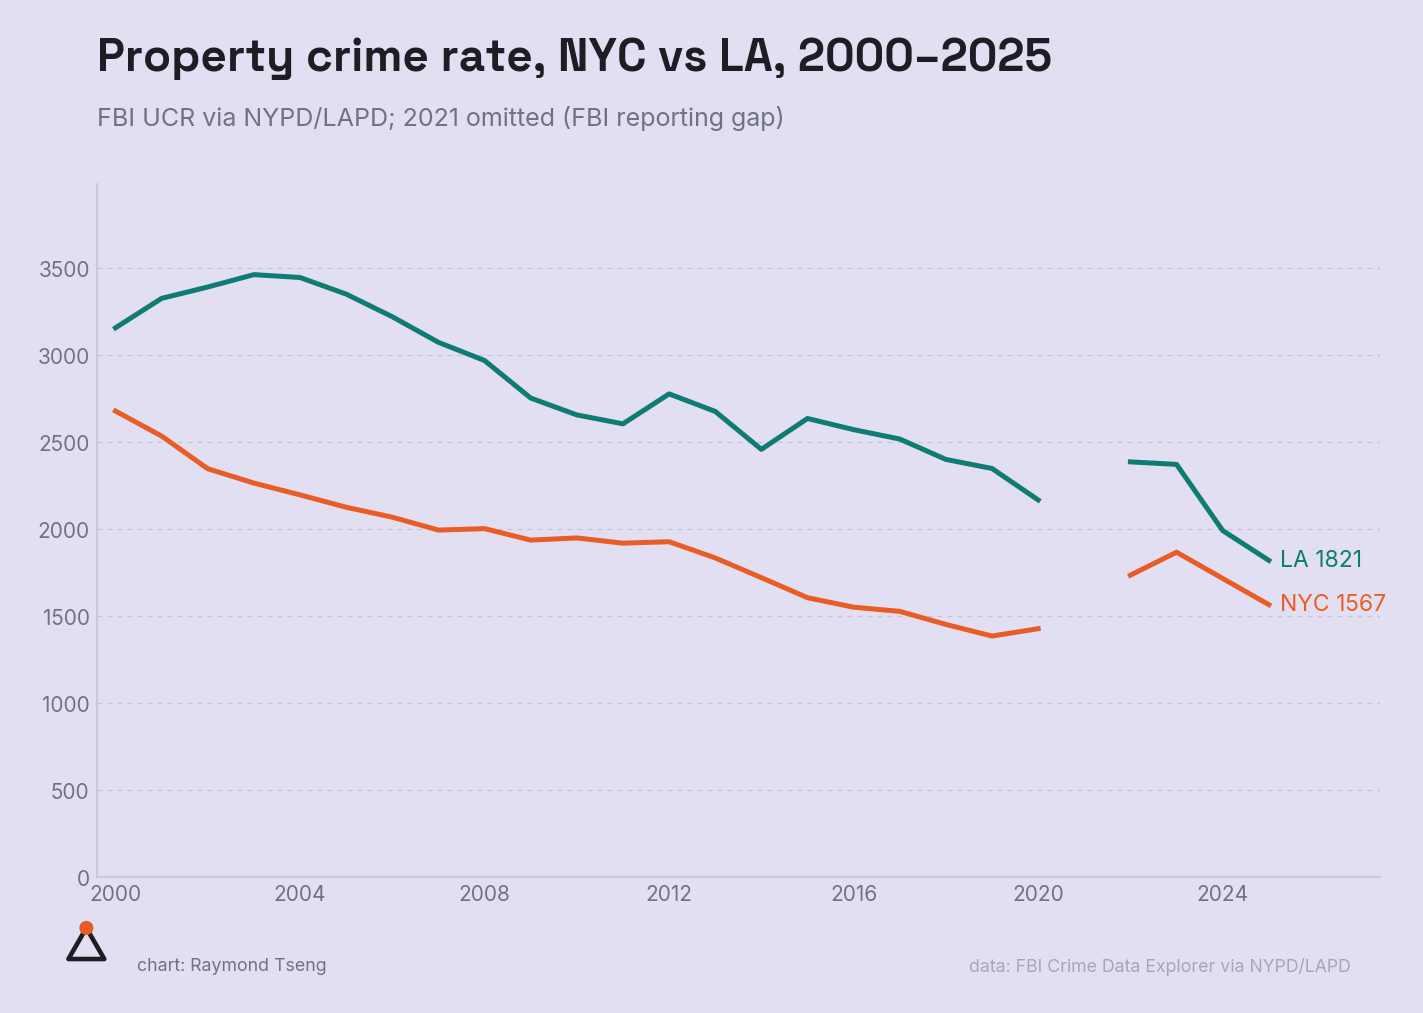
Property crime rate, NYC vs LA, 2000–2025
Per 100k residents (FBI UCR). The long decline never really reversed — both cities are at or near series lows.
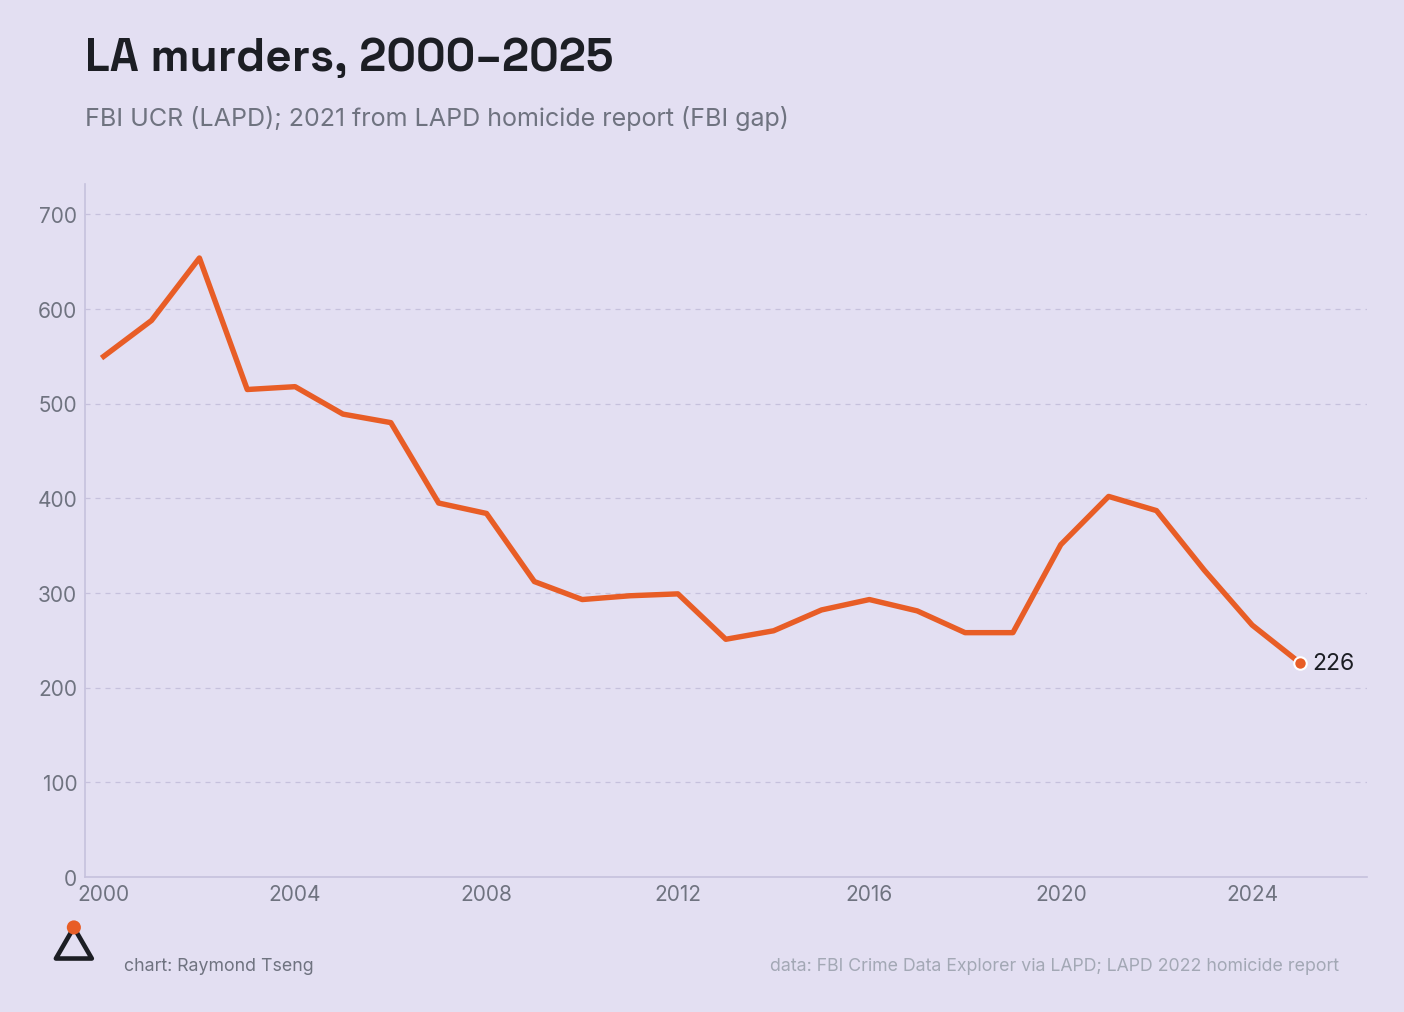
LA murders, 2000–2025
From 550 to 226: the long decline, the 2020–21 spike to 402, and the fall to a near-record low (FBI UCR via LAPD).
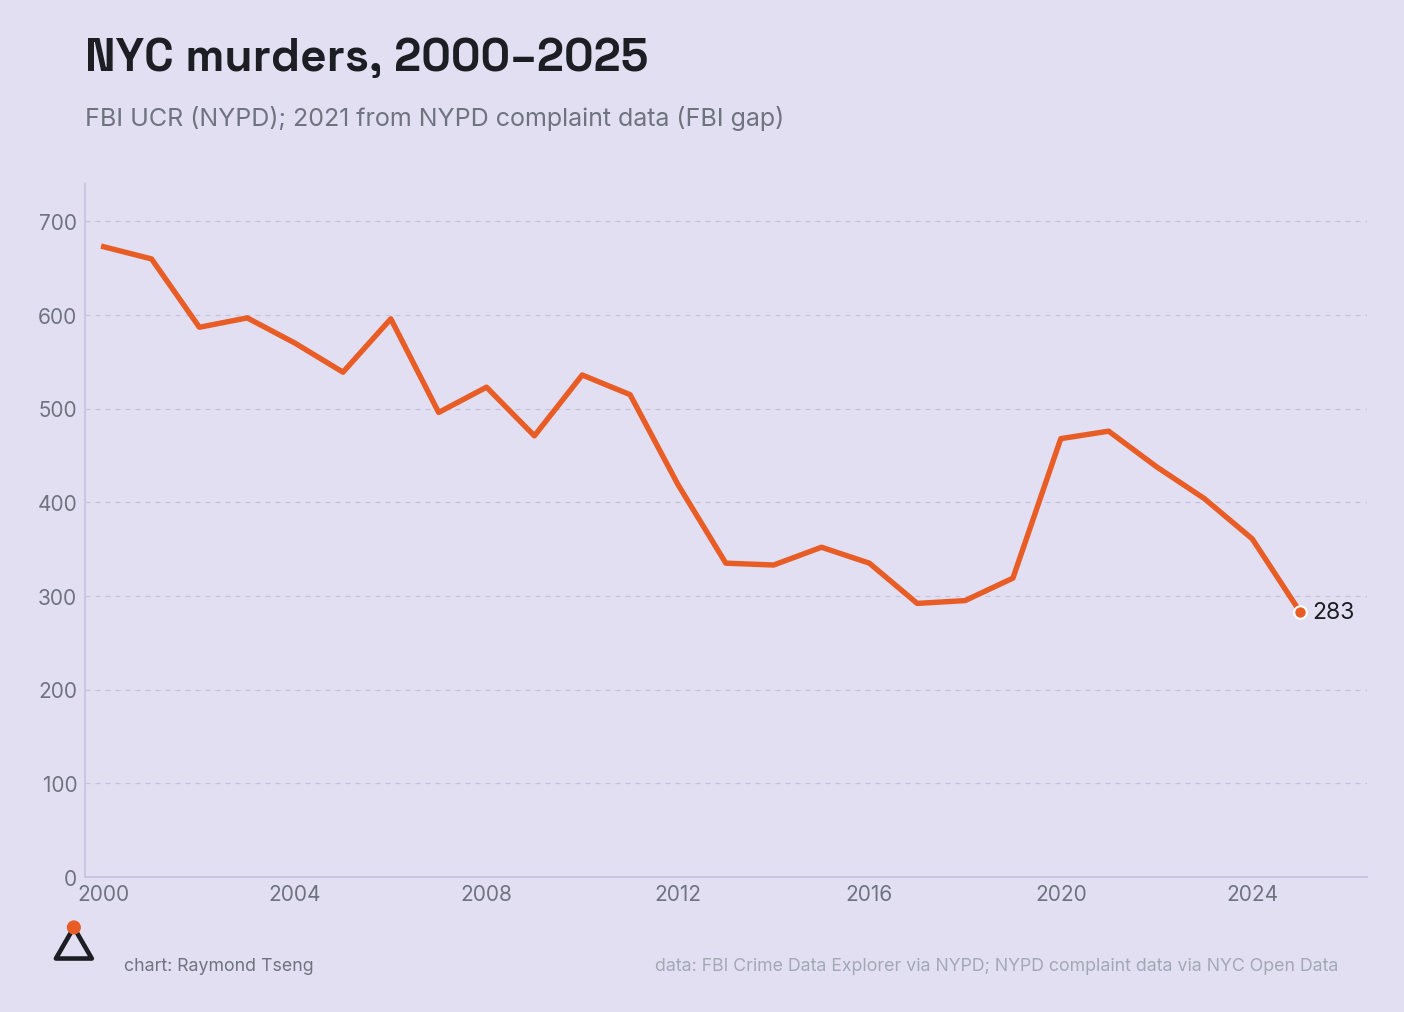
NYC murders, 2000–2025
From 673 to 283: the long decline, the 2020–21 spike, and the series low (FBI UCR via NYPD).
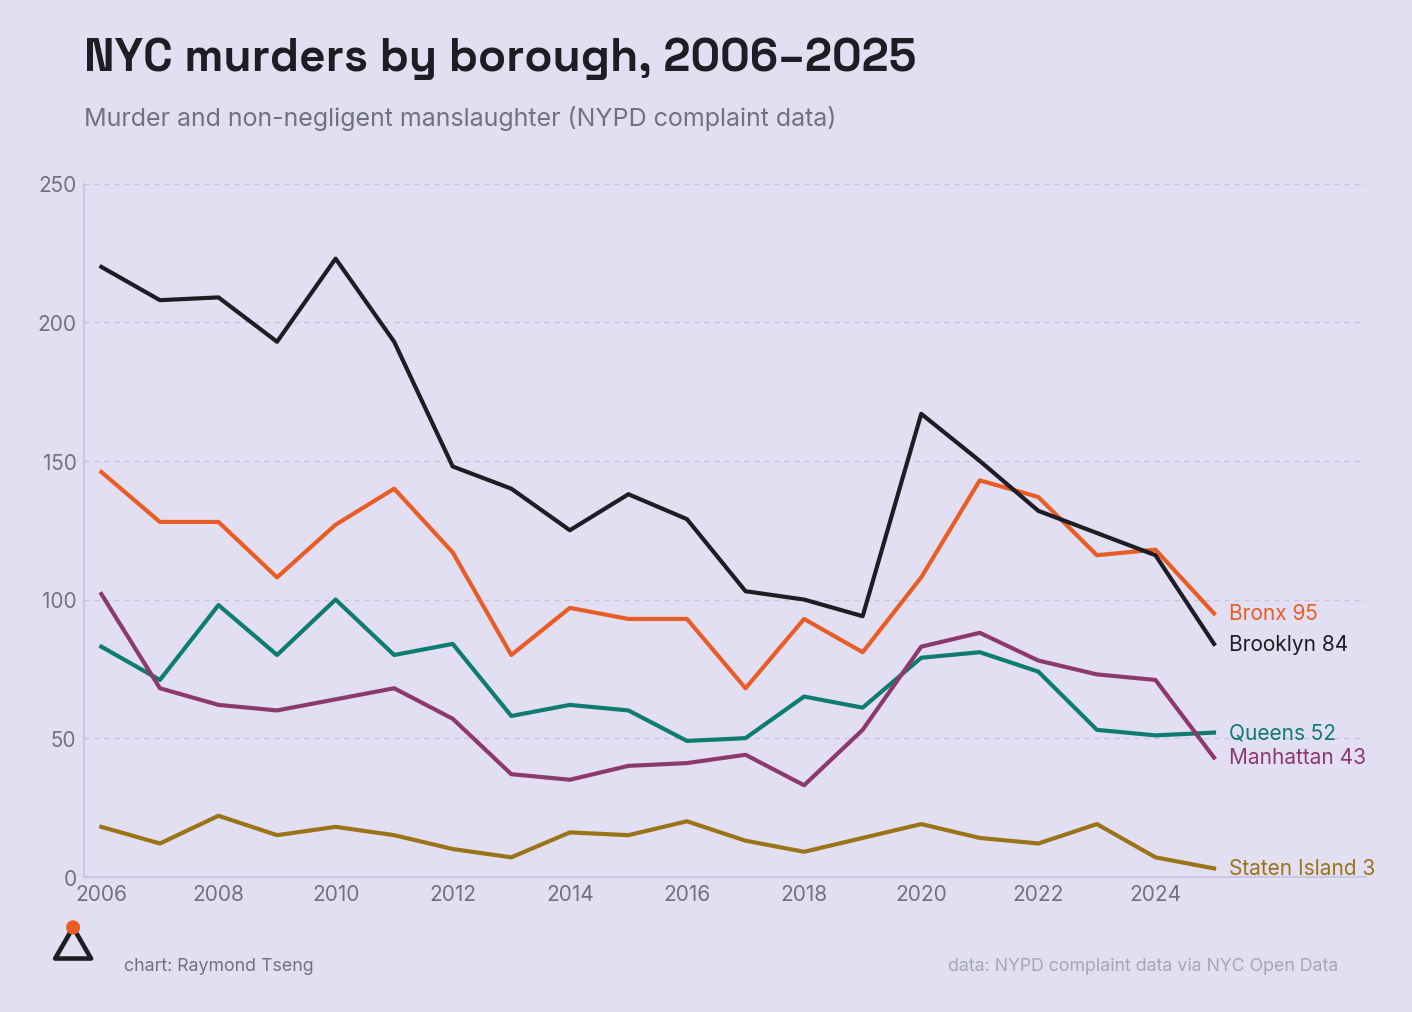
NYC murders by borough, 2006–2025
The 2020 spike was a Bronx and Brooklyn story; Manhattan's 2025 count fell below Queens (NYPD complaint data).
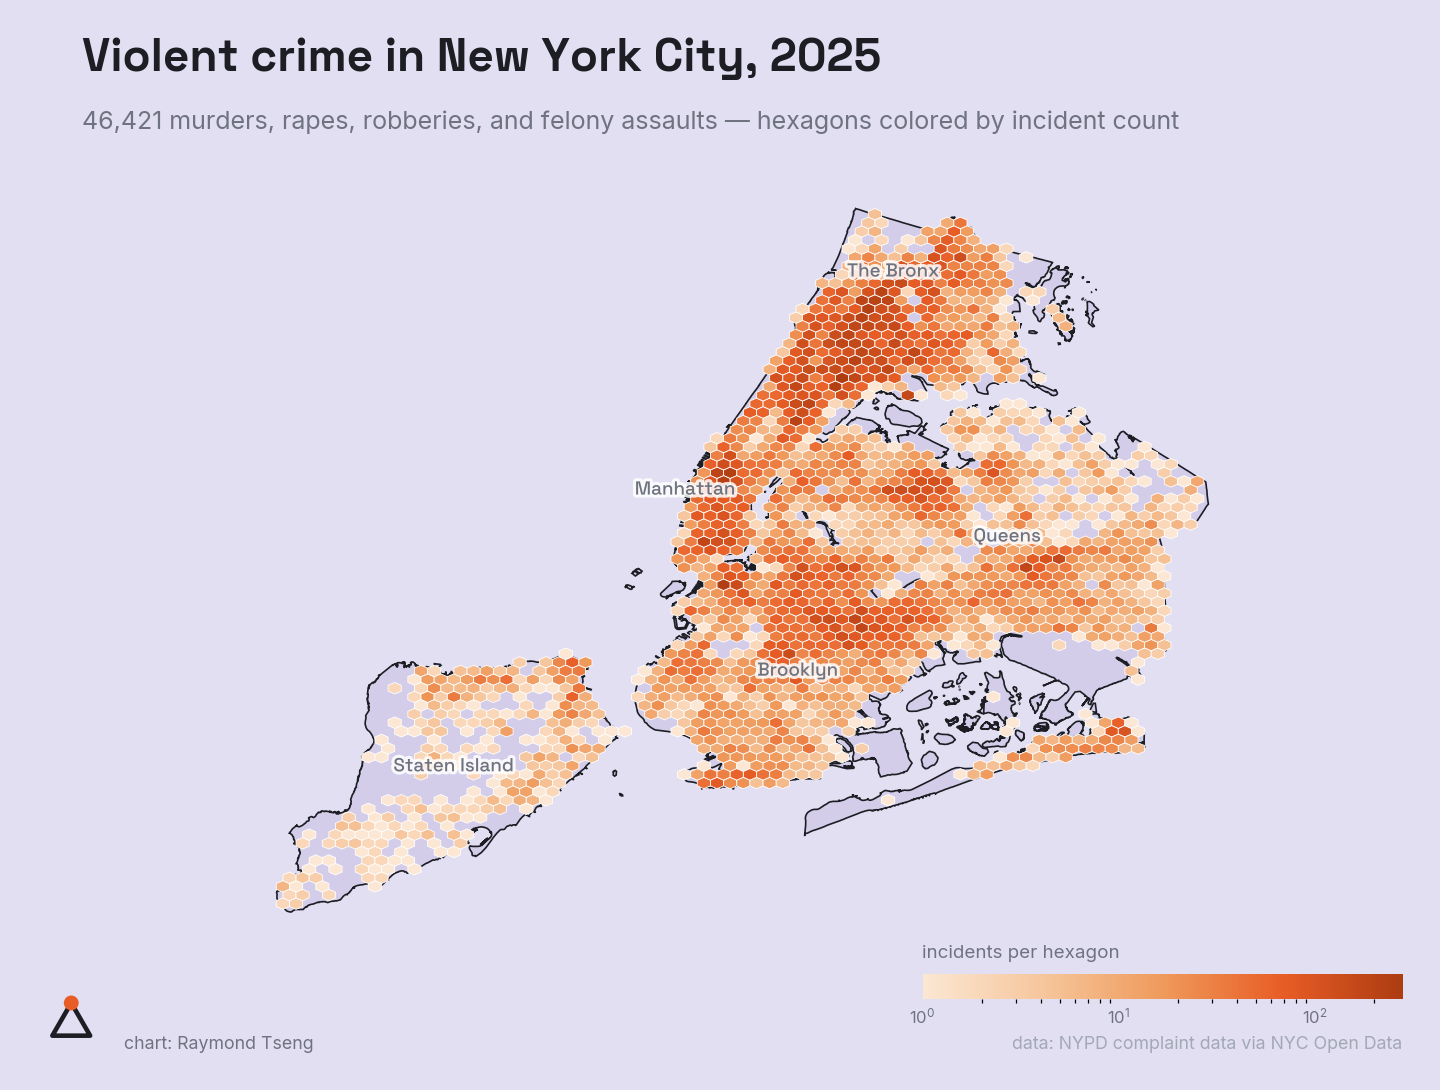
Violent crime in New York City, 2025
46,421 murders, rapes, robberies, and felony assaults — hexagons colored by incident count (NYPD complaint data).
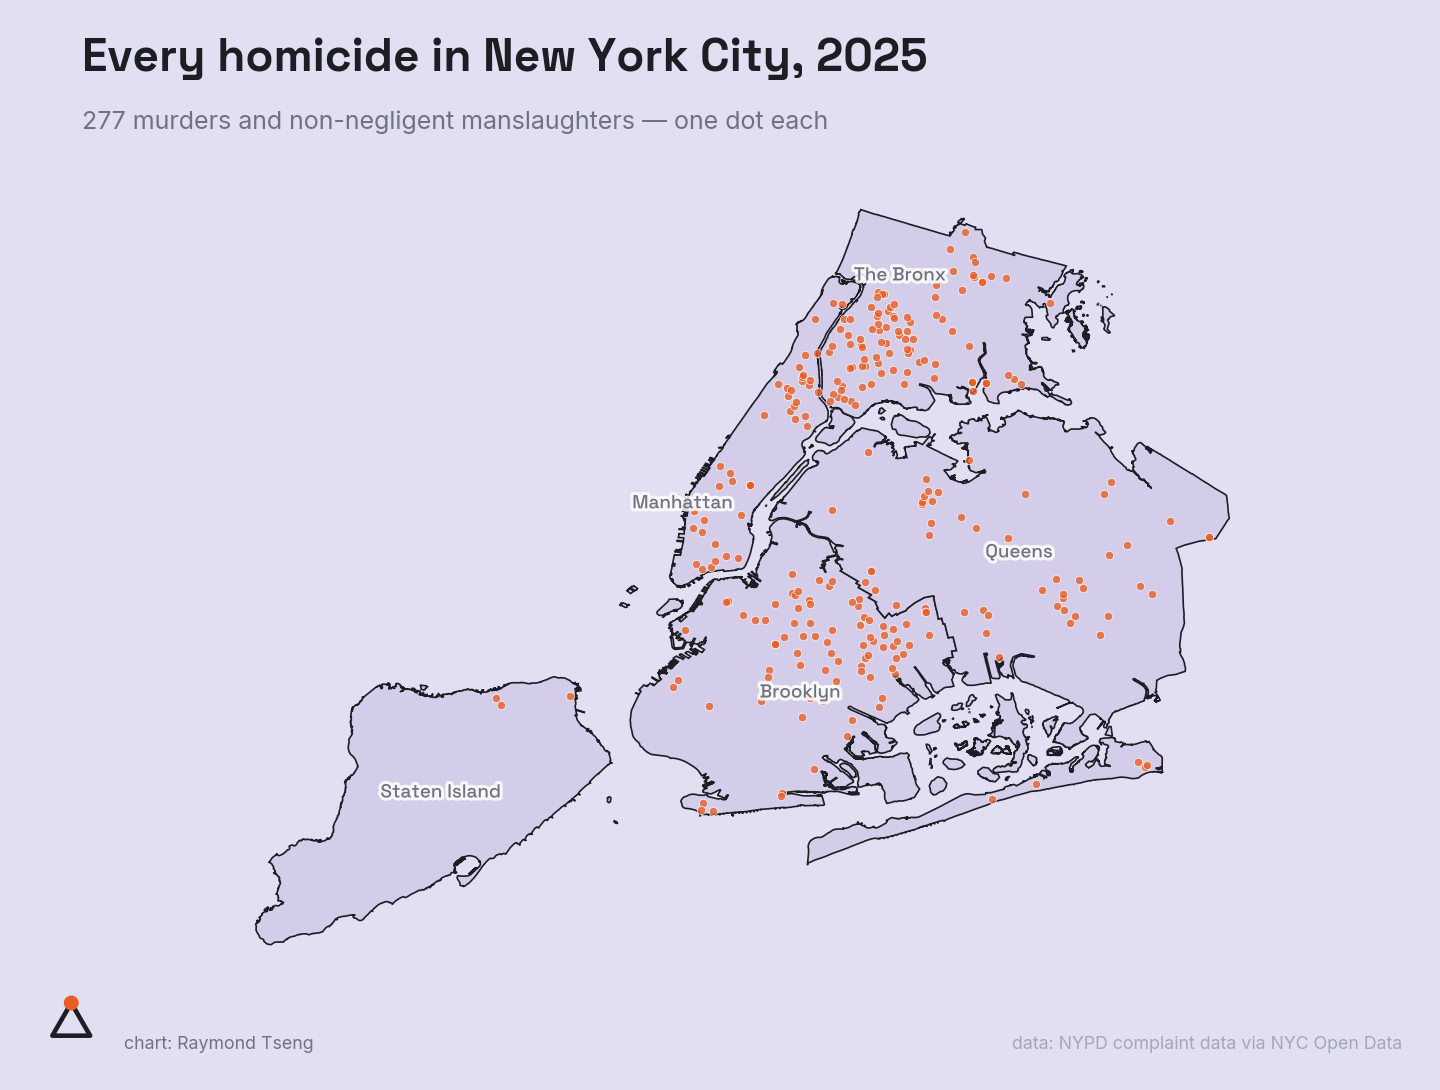
Every homicide in New York City, 2025
277 murders and non-negligent manslaughters — one dot each (NYPD complaint data).
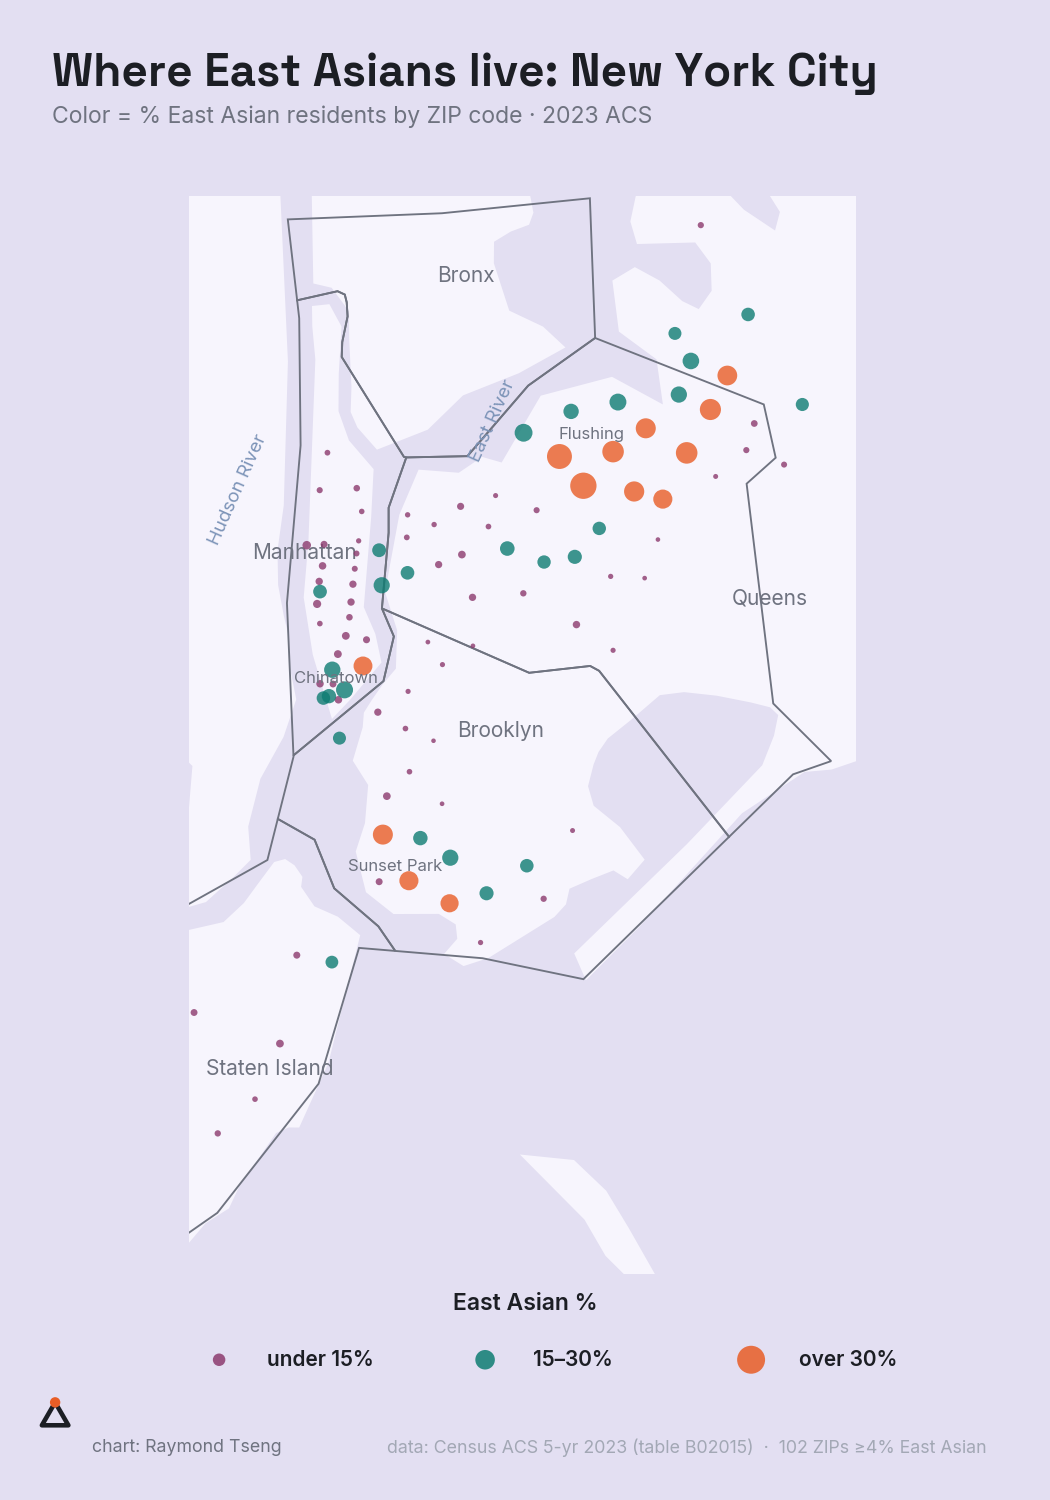
Where East Asians live: New York City
East Asian share by ZIP: Flushing and Sunset Park run past 30% (2023 ACS).
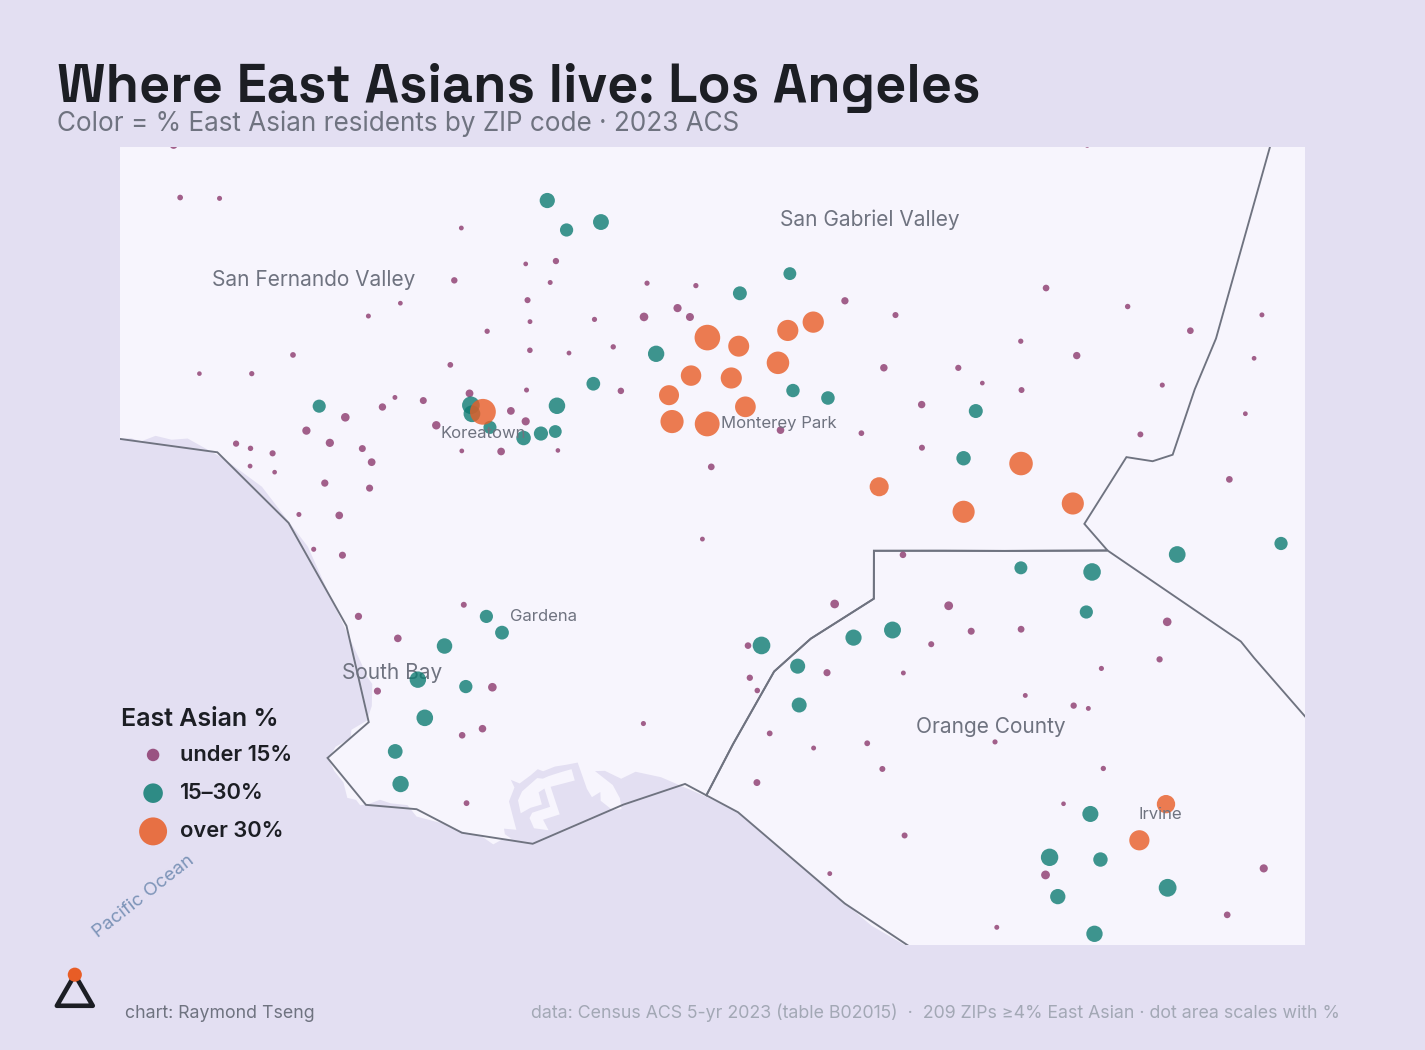
Where East Asians live: Los Angeles
LA's East Asian geography: the San Gabriel Valley cluster and Koreatown (2023 ACS).
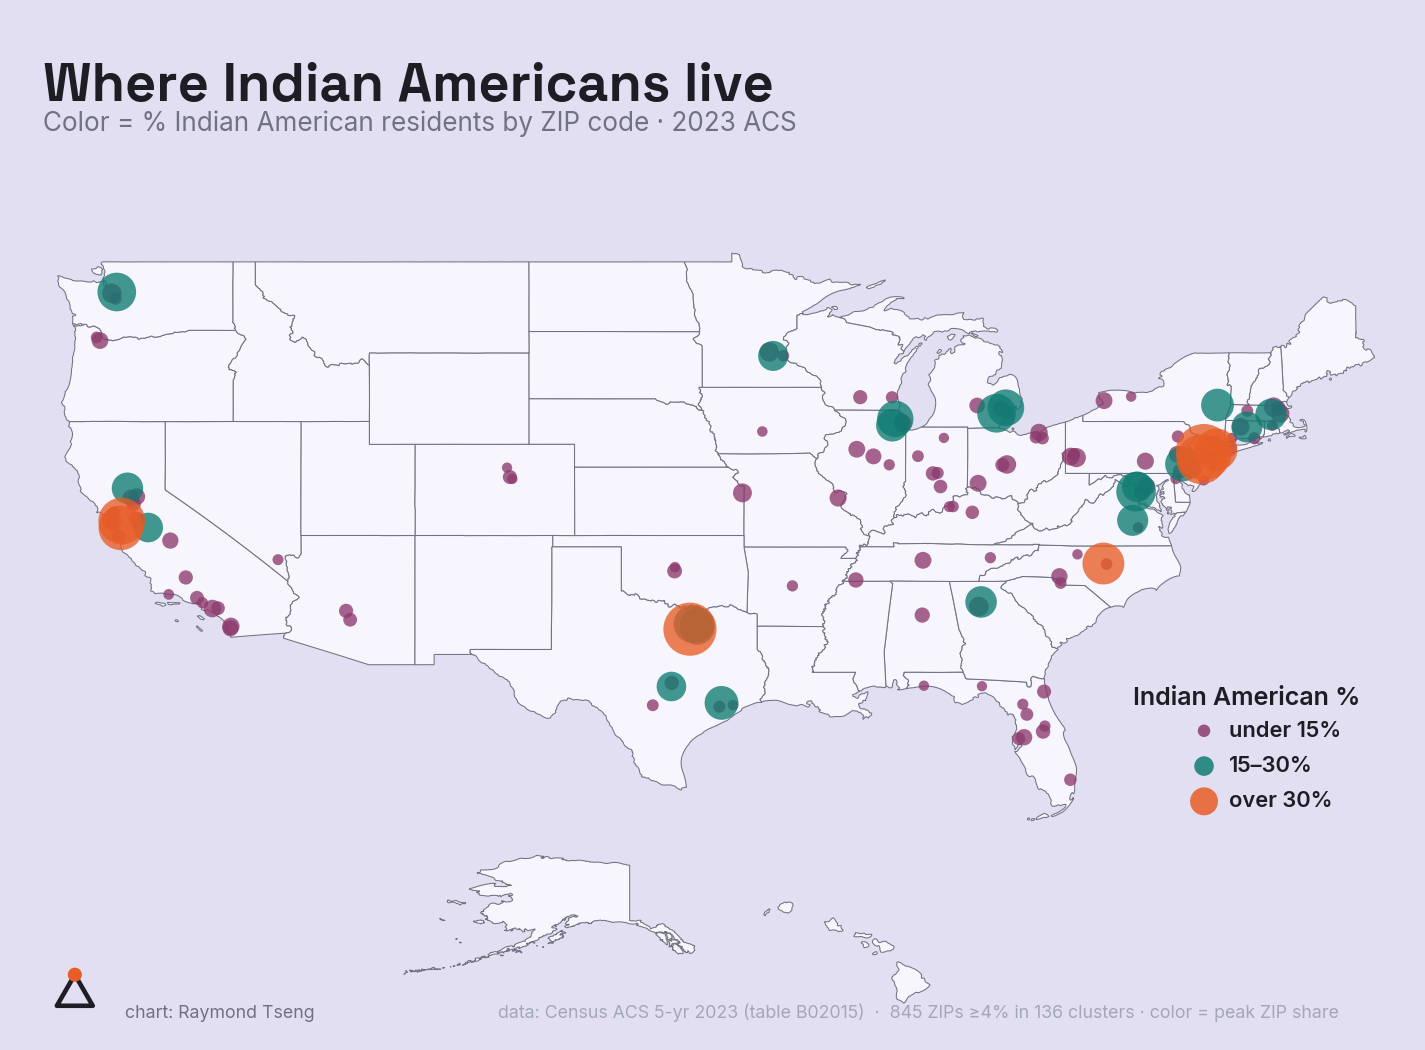
Where Indian Americans live
Indian American ZIP clusters: New Jersey, the Bay Area, and Texas lead (2023 ACS).
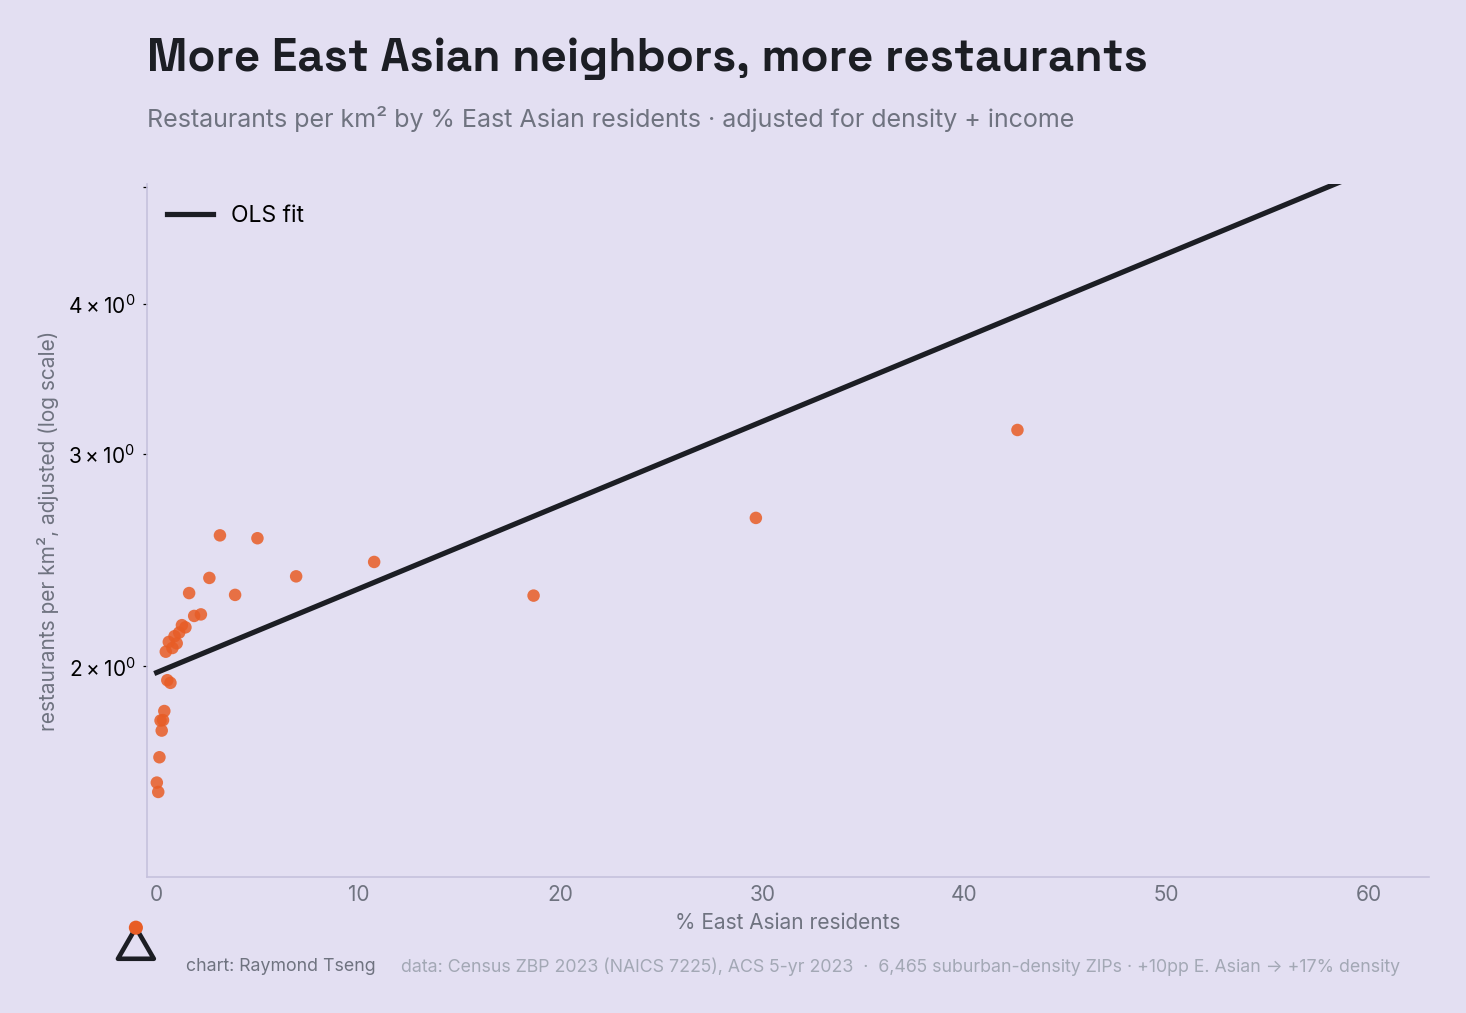
More East Asian neighbors, more restaurants
+10 points of East Asian share → +17% restaurant density, adjusted for density and income (6,465 ZIPs).
Economics
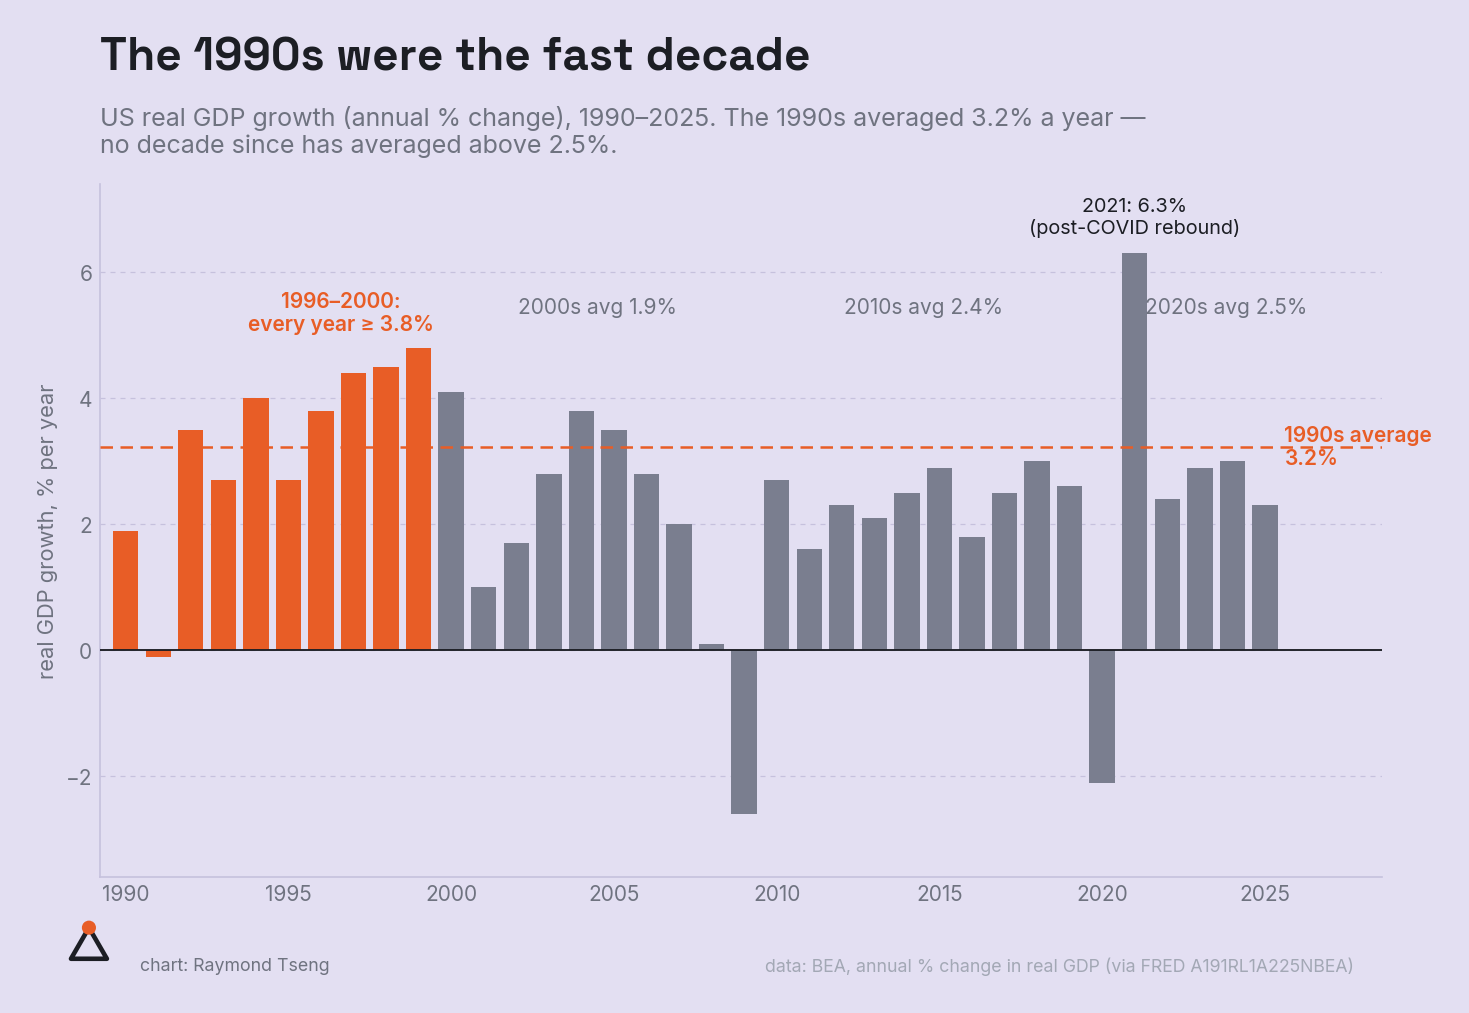
The 1990s were the fast decade
US real GDP growth by year, 1990–2025, with the 1990s highlighted. The 90s averaged 3.2%/yr; no decade since has averaged above 2.5%. (BEA.)
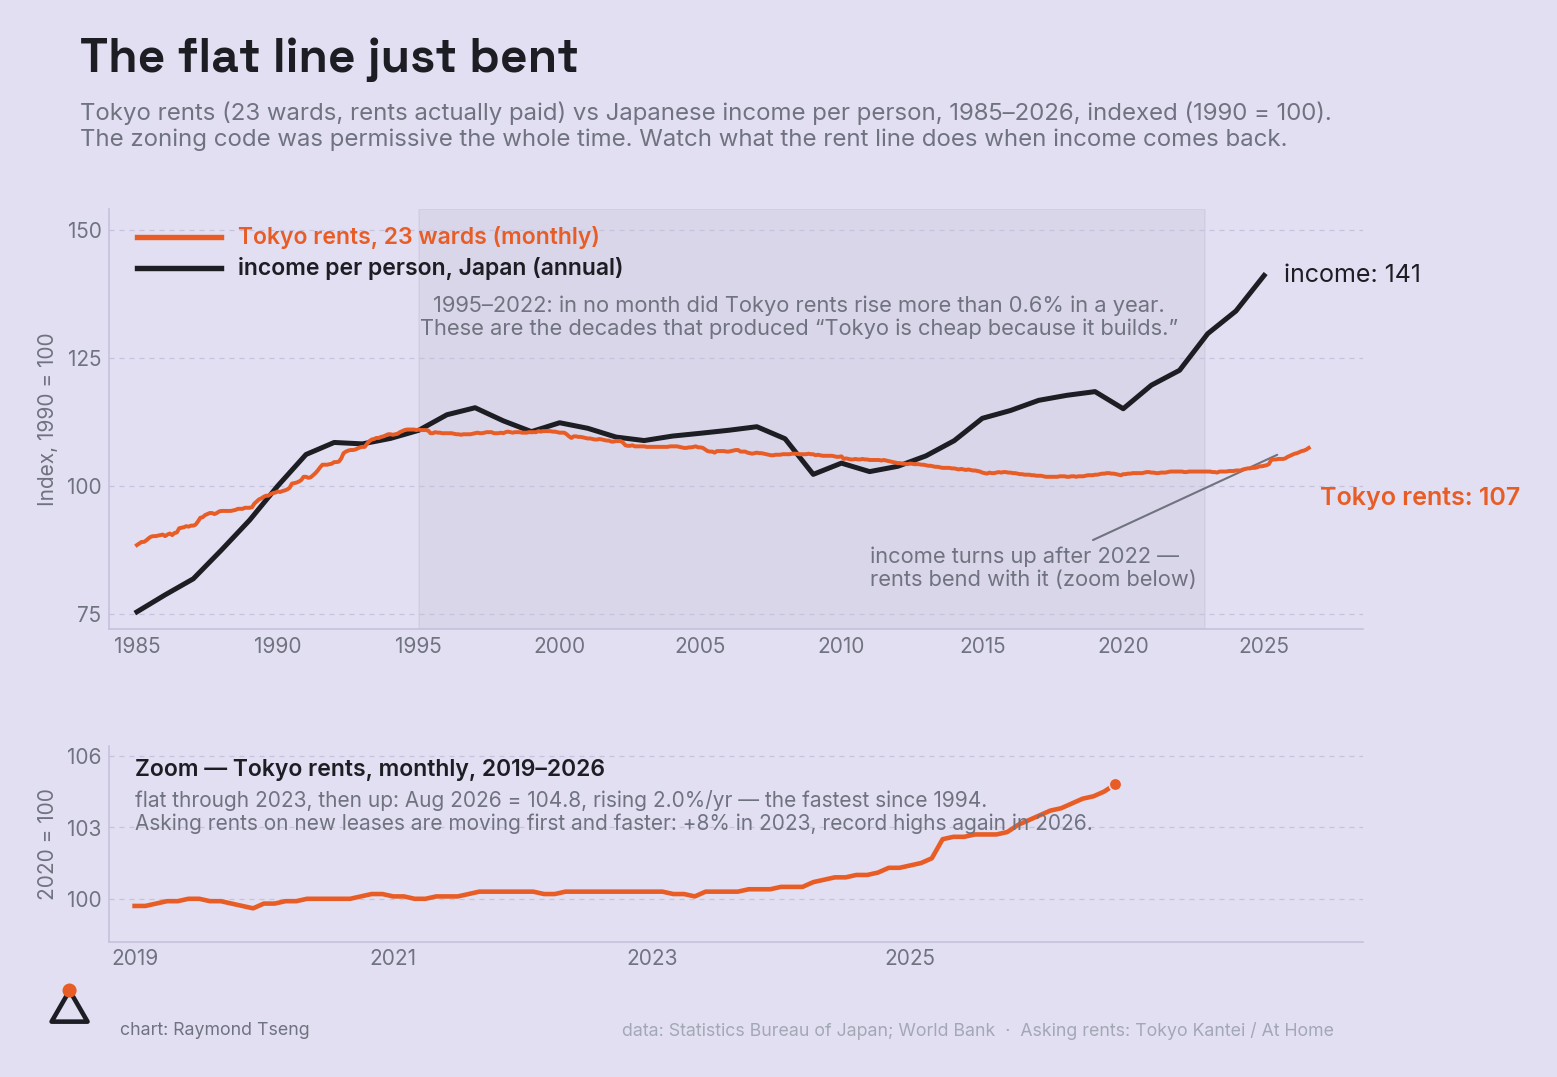
The flat line just bent
Tokyo rents vs income, 1985–2026, with a 2019–26 zoom. Twenty-five flat years, then the bend — timed to income, not to any zoning change. (Statistics Bureau of Japan; World Bank.)
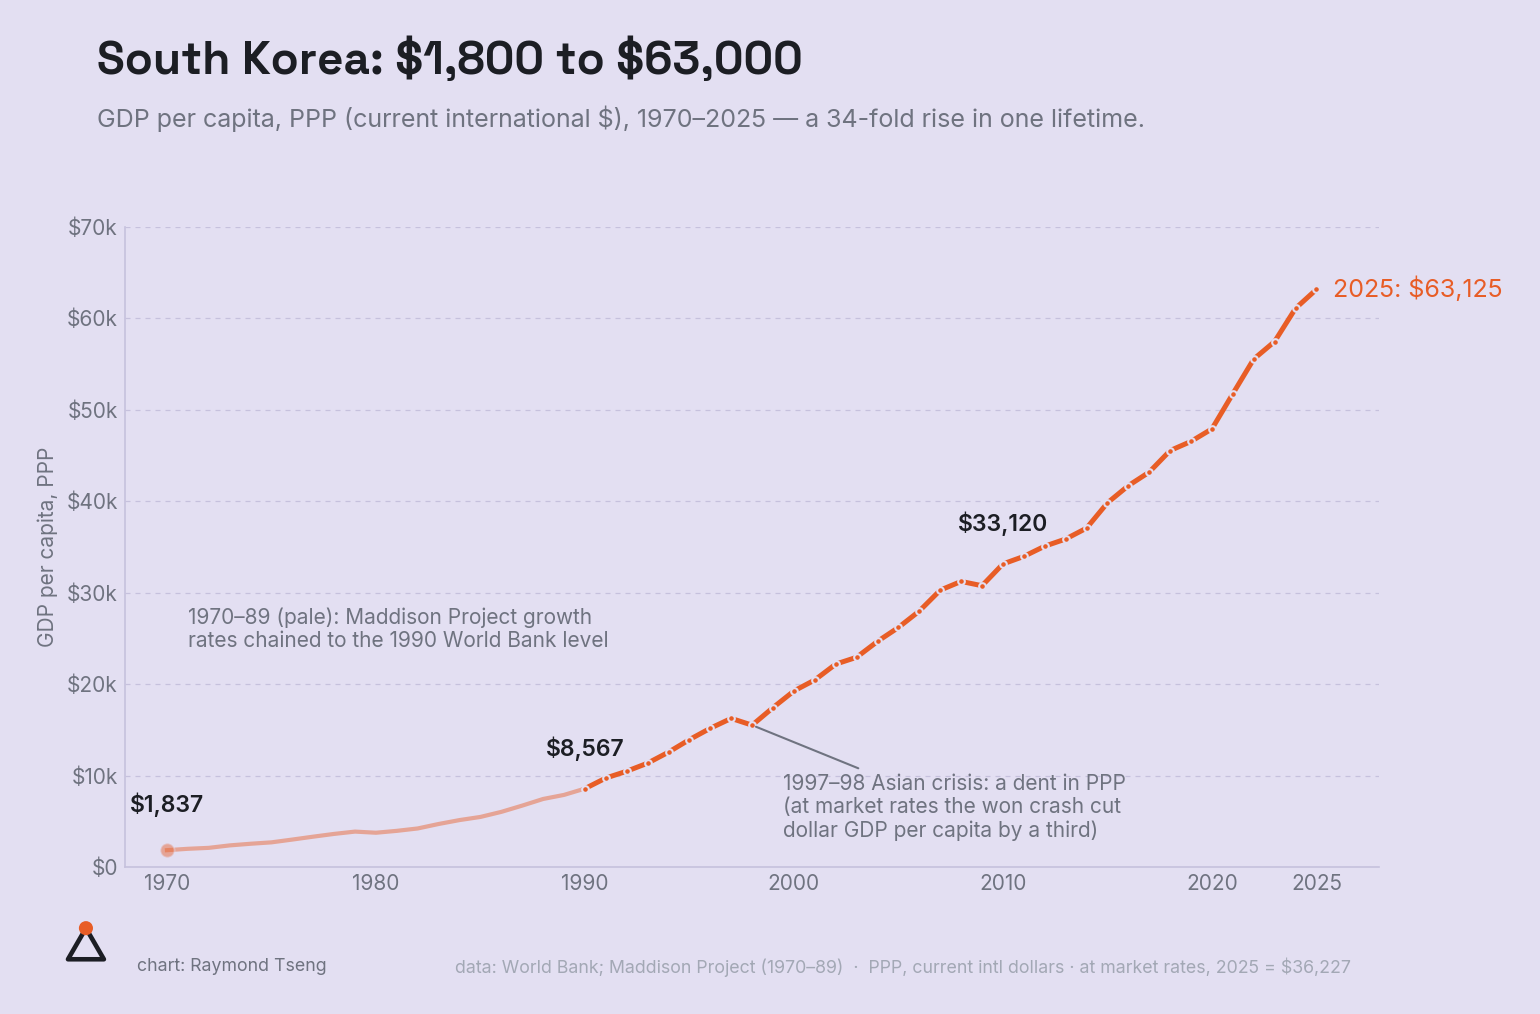
South Korea: $1,800 to $63,000
GDP per capita, PPP, 1970–2025. A 34-fold rise in one lifetime — and the Asian crisis is just a dent at PPP. (World Bank; Maddison Project for 1970–89.)
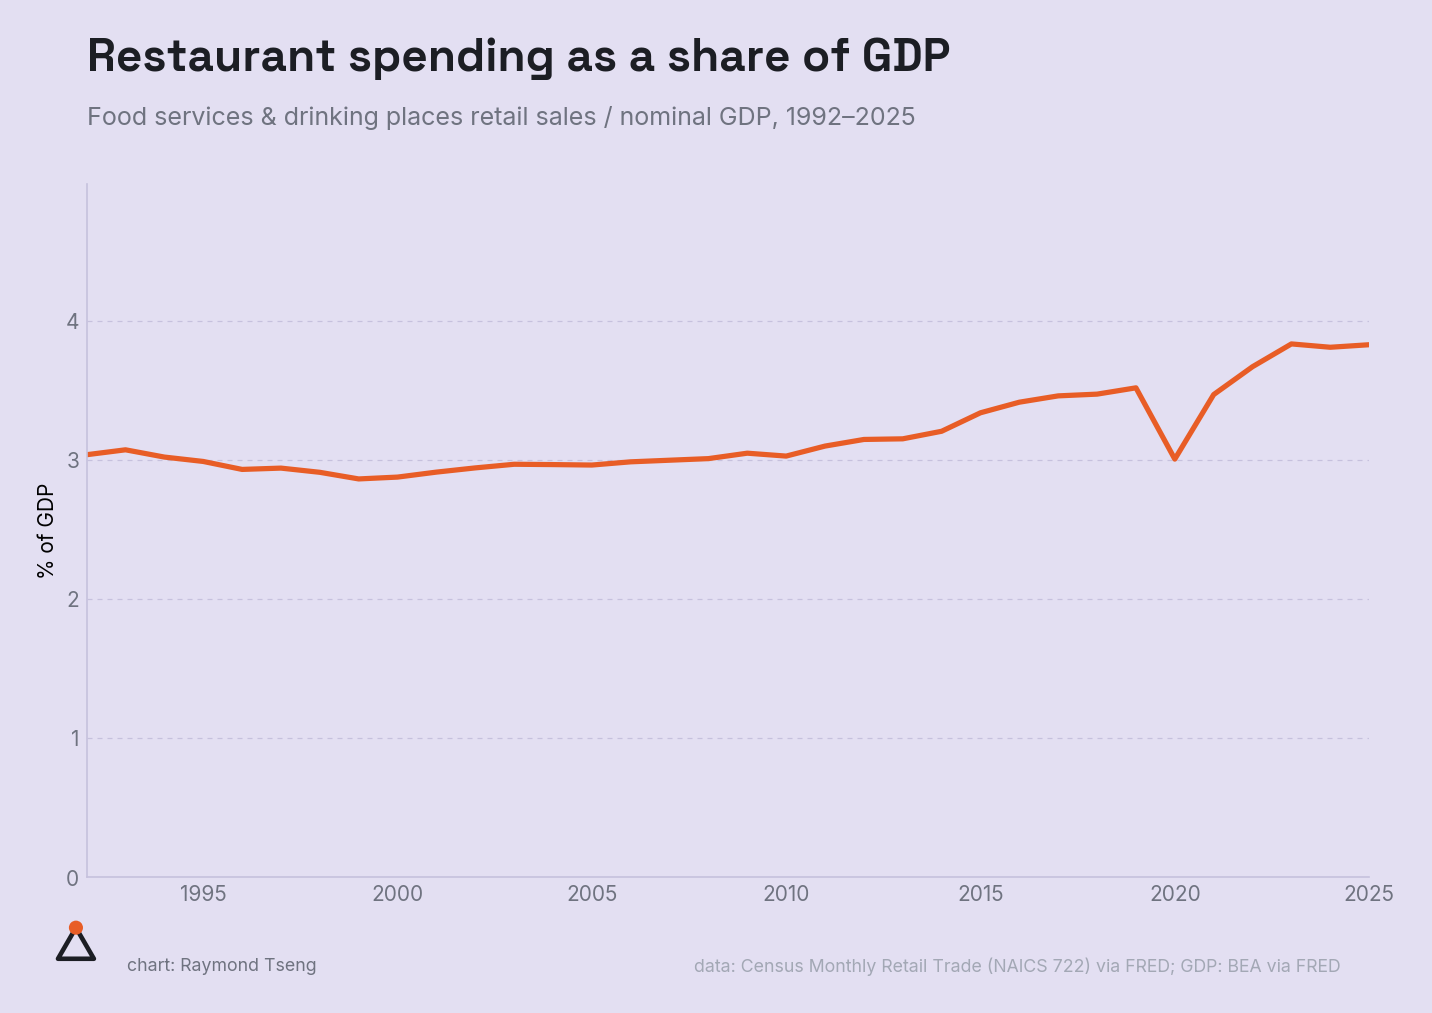
Restaurant spending as a share of GDP
Food services & drinking places retail sales / nominal GDP, 1992–2025. Flat ~3% through the 2000s, then rising to ~3.8% — restaurants gained share from groceries, so this one isn't a fixed Evans-style share.
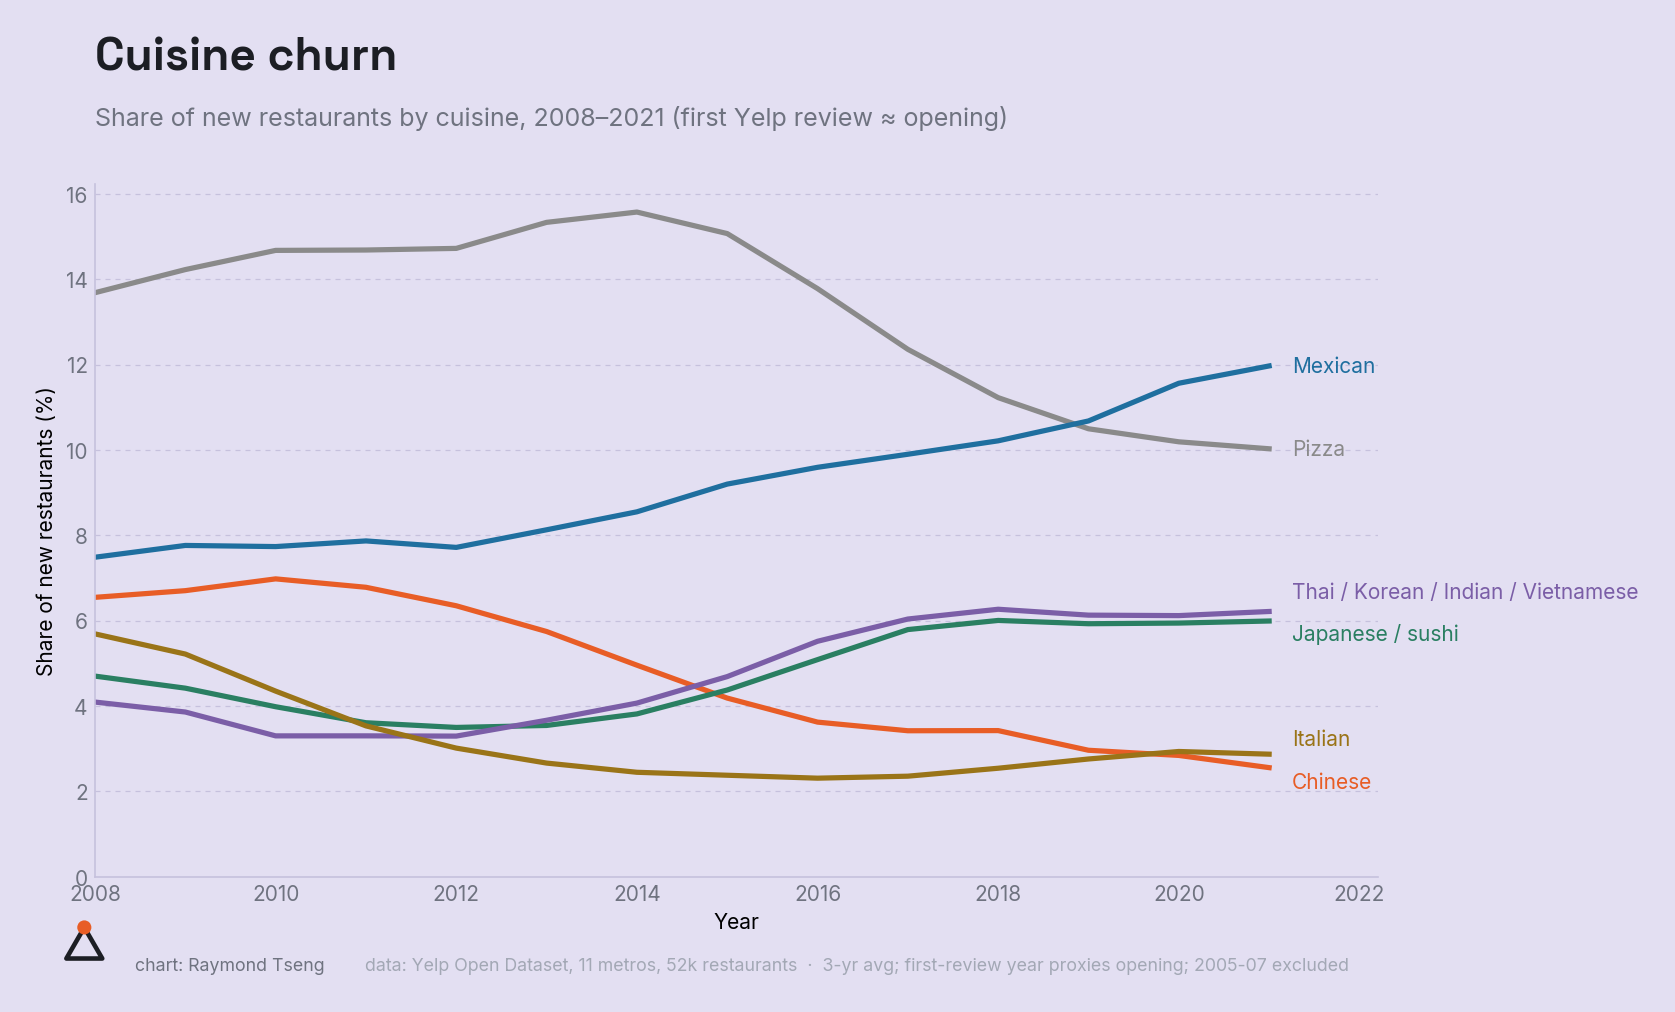
Cuisine churn
Share of new restaurants by cuisine, 2008–2021. Chinese and Italian each lost ~half their share of openings; Japanese/sushi and Thai/Korean/Indian/Vietnamese rose. "Asian" as a total barely moved — the churn was within it.
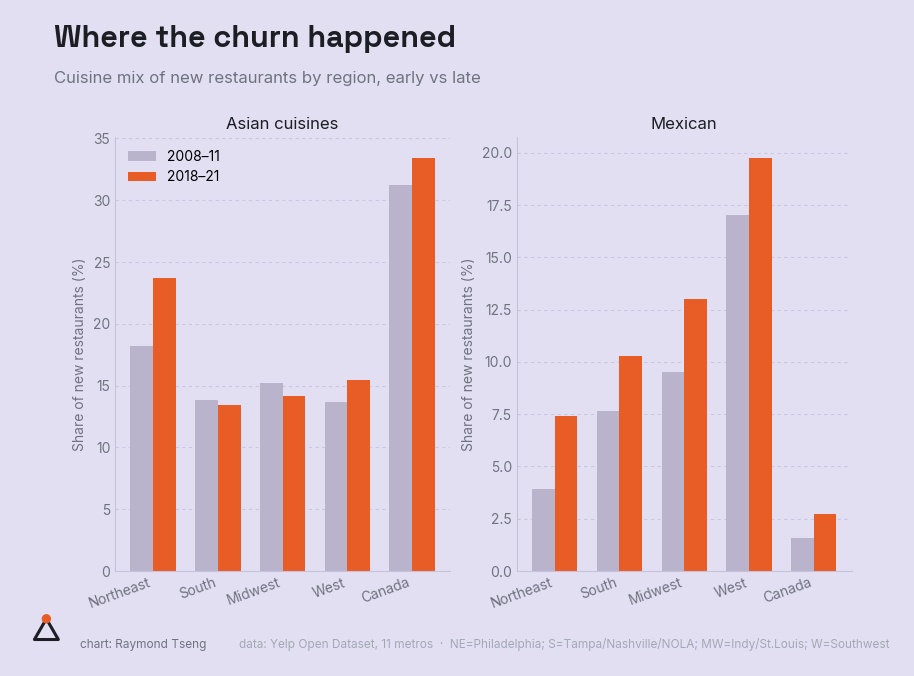
Where the churn happened
Cuisine mix of new restaurants by region, early vs late. Mexican rose everywhere; Asian share jumped in the Northeast; Edmonton is 30%+ Asian.
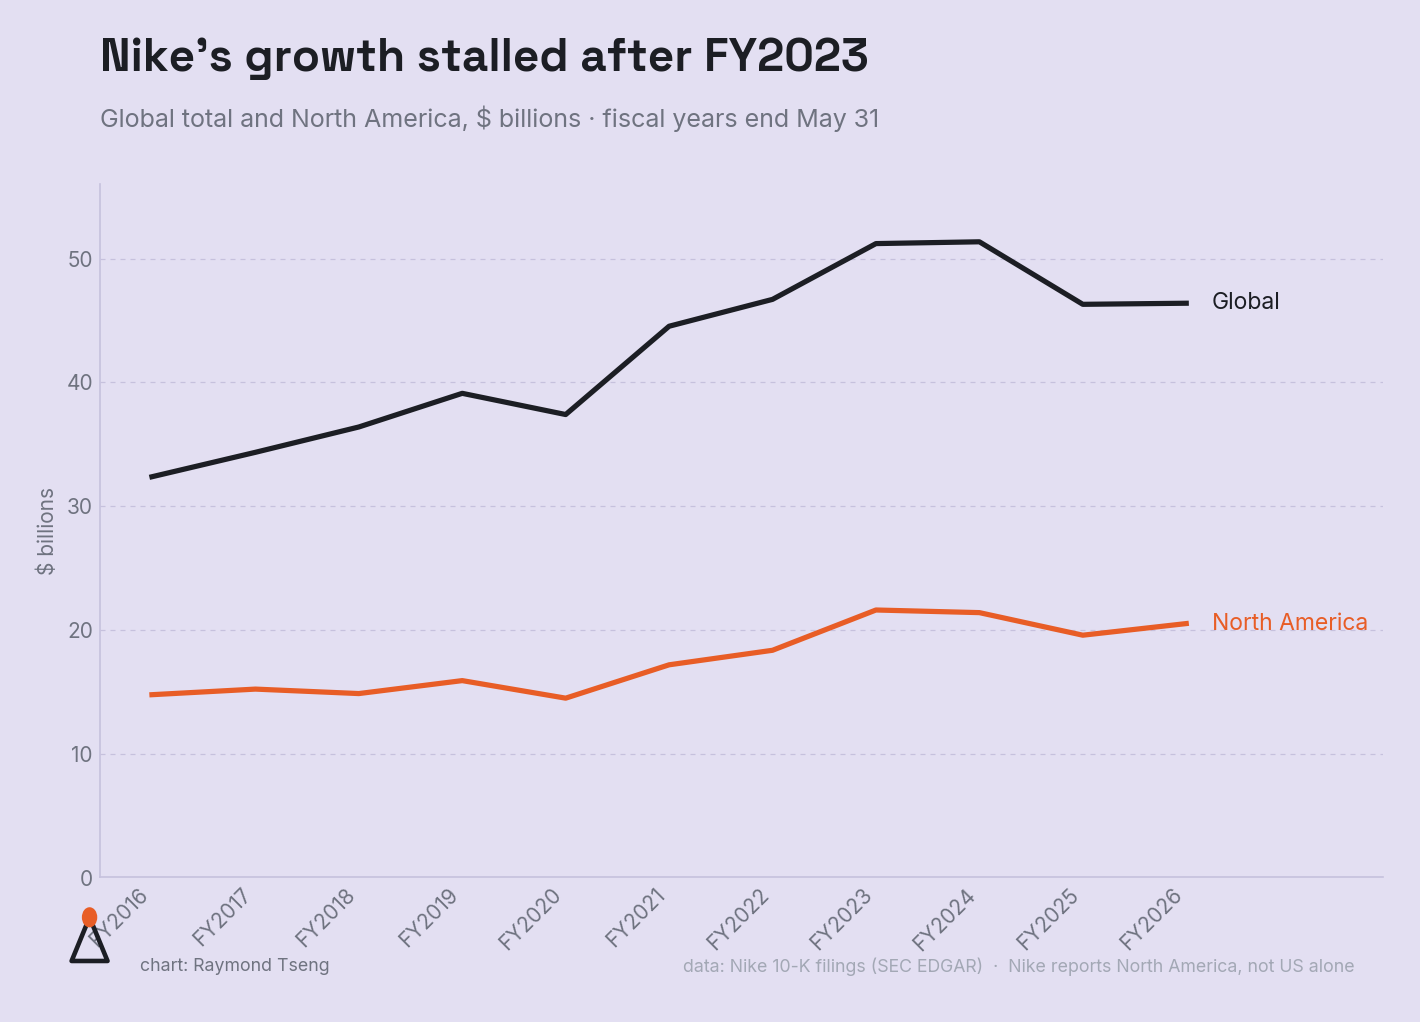
Nike's growth stalled after FY2023
Global revenue peaked in FY2024 and slipped; North America flattened (fiscal years end May 31).
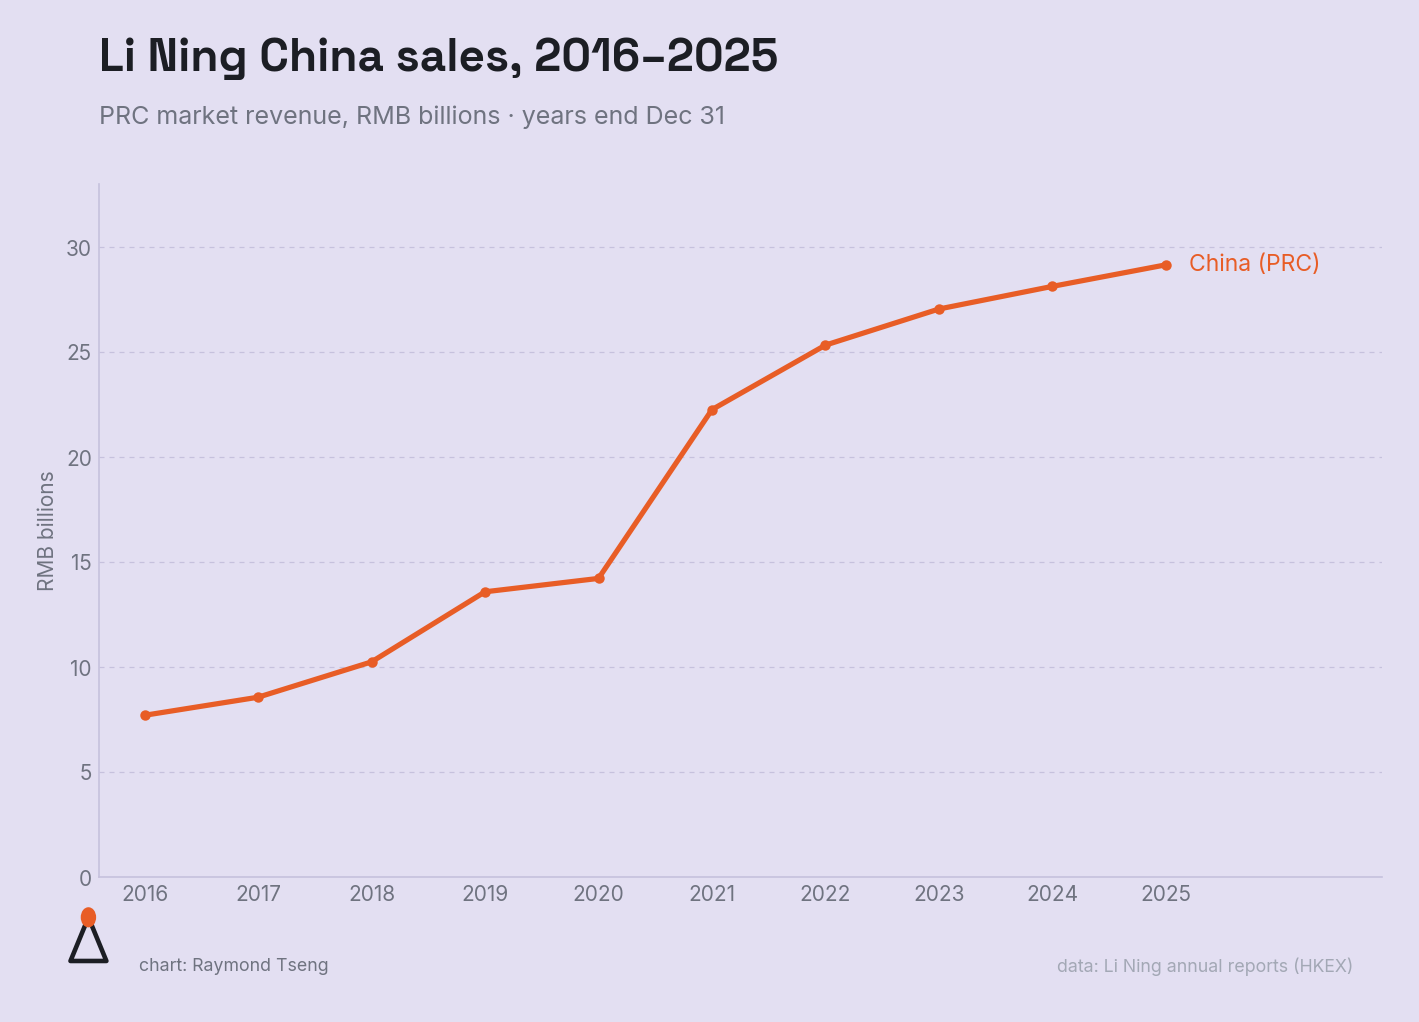
Li Ning China sales, 2016–2025
A decade of near-4x growth in mainland China revenue, 2016–2025.
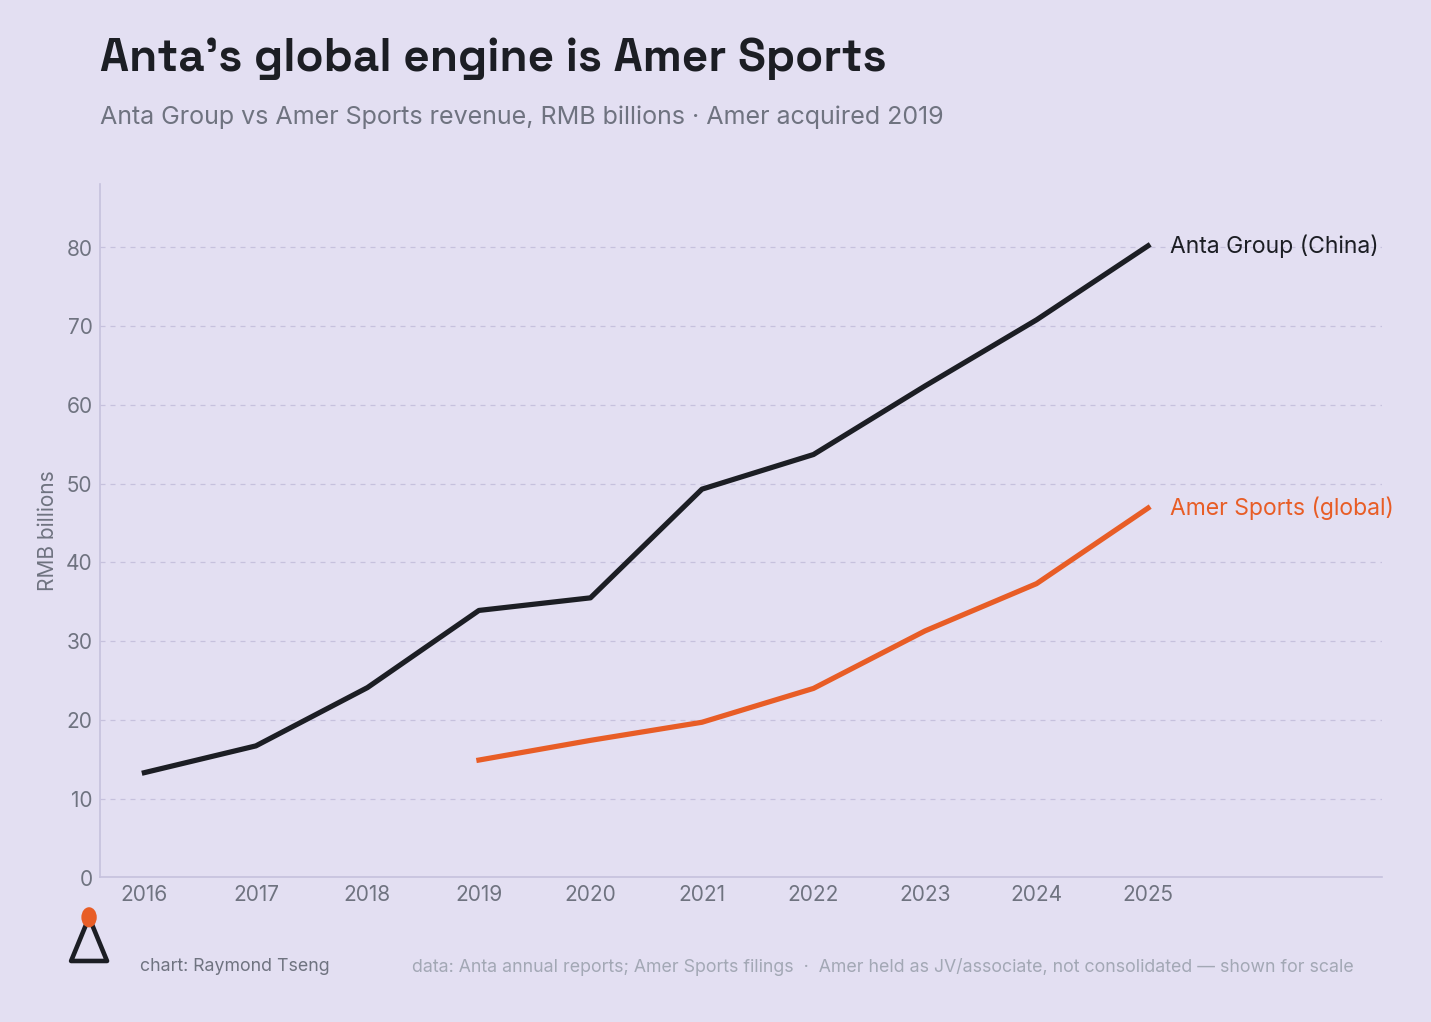
Anta's global engine is Amer Sports
Amer Sports — acquired 2019 — is now the growth engine behind Anta Group.